Category Archives: Economy

Real GDP Grows 2.9% in 3rd Quarter, Exports up 10%, Consumer Spending Strong

Unfortunately for Donald Trump, whose candidacy depends upon economic suffering, the US economy continues to grow, in fact, Real GDP grew 2.9% in the third quarter, and exports grew at 10%, the fastest quarterly pace since 2013, while consumer spending continued to grow at a solid pace.

But with the disinformation campaign intact,  which the Trump campaign sees as the only way to an increasingly elusive victory, Dan Kowalski, Trump’s Deputy Policy Director,  stated, “America can do better than the modest growth of 2.9 percent recorded for the 3rd quarter and the dismal growth of 1.5 percent for the past year. Growth hasn’t risen above 3 percent for a full year in any year of the Obama presidency. Decades of strong economic growth and global leadership have been replaced with low-paying jobs, global chaos and a national debt that has doubled under Obama-Clinton.

“The single most important issue facing the American people is an economy that has failed to deliver jobs, incomes, and opportunity. The Trump economic plan creates at least 25 million jobs and 4 percent growth through tax, trade, energy and regulatory reforms.” 

In contrast, Hillary for America Senior Policy Advisor Jacob Leibenluft stated: “Today’s GDP release shows economic growth at its fastest pace in two years. With more than 15 million jobs created since early 2010 and real median incomes growing more than 5 percent last year, it’s clear we’ve made real progress coming back from the crisis. But Hillary Clinton believes there is still more we need to do to build an economy that works for everyone, not just those at the top. Independent experts agree her plan would create good-paying jobs through investments in infrastructure, innovation and education. Donald Trump, on the other hand, would take us backwards, with experts across the political spectrum warning his plans would risk another recession and cost jobs.”


Jason Furman, Chairman of the Council of Economic Advisers, issued the following statement today on the advance estimate of GDP for the third quarter of 2016. You can view the statement HERE.

Summary: Real GDP grew 2.9 percent at an annual rate in the third quarter, with strong export growth and continued strength in consumer spending.

The economy grew 2.9 percent at an annual rate in the third quarter of 2016, a noticeably faster pace than in the first half of the year. Exports, which have faced significant headwinds in recent years from slow growth abroad, grew at an annual rate of 10.0 percent in the third quarter, their fastest quarterly pace since 2013. Consumer spending continued to grow at a solid pace in the third quarter, while inventory investment (one of the most volatile components of GDP) boosted GDP growth after subtracting from it in the prior five quarters. In contrast to the pattern of recent quarters, business fixed investment also contributed positively to GDP growth, though it continues to be restrained by slower global growth. But more work remains to strengthen economic growth and ensure that it is broadly shared, and the President will continue to take steps to promote greater competition across the economy, including in the labor market; support innovation; and call on Congress to increase investments in infrastructure and to pass the high-standards Trans-Pacific Partnership.

FIVE KEY POINTS IN TODAY’S REPORT FROM THE BUREAU OF ECONOMIC ANALYSIS (BEA)

  1. Real Gross Domestic Product (GDP) increased 2.9 percent at an annual rate in the third quarter of 2016, according to BEA’s advance estimate. Consumer spending grew 2.1 percent in the third quarter following its strong second-quarter growth of 4.3 percent, with continued solid growth in durable goods spending and a contraction in nondurable goods spending. Inventory investment—one of the most volatile components of GDP—added 0.6 percentage point to GDP growth in the third quarter after subtracting 1.2 percentage point in the second quarter. Nonresidential fixed investment contributed positively to GDP growth for the second quarter in a row, due in large part to a pickup in structures investment growth (see point 4 below). Residential investment declined for the second quarter in a row, albeit at a slower pace in the third quarter than in the second quarter. Notably, exports grew 10.0 percent at an annual rate in the third quarter, its fastest quarterly growth since late 2013, despite continued headwinds from slow growth abroad (see point 3 below).

 Chart1

  1. The pace of third-quarter real GDP growth was noticeably faster than its pace in the first half of 2016. Real GDP growth averaged 1.1 percent at an annual rate in the first half of 2016. The pickup in growth in the third quarter can be attributed largely to two components of GDP: inventory investment and exports. In the first half of the year, these components contributed -0.8 percentage point and 0.1 percentage point, respectively, to overall real GDP growth. Both components saw substantial pickups in growth in the third quarter relative to the first half of the year: inventory investment contributed 0.6 percentage point to GDP growth, while exports contributed 1.2 percentage point, their second-largest quarterly contribution to growth since 2010. Other components of GDP, including both structures and equipment investment and government purchases, also saw faster growth or smaller contractions in the third quarter. These were partly offset by smaller positive contributions from consumer spending and intellectual property products investment and a larger negative contribution from residential investment.

Chart2

  1. Real exports grew 10.0 percent in the third quarter, their fastest quarterly growth since 2013. In recent years, slowing global demand has been a key headwind to U.S. growth, as the volume of U.S. exports to foreign countries is sensitive to GDP growth abroad. In its October World Economic Outlook, the International Monetary Fund (IMF) revised down its forecast of global growth for the four quarters of 2016, removing an expected pickup in growth from 2015 to 2016. The IMF currently forecasts global growth to pick up in 2017, suggesting less downward pressure on export growth going forward. Nevertheless, real export growth in the third quarter was substantially faster than in recent quarters, due in part to a large increase in agricultural exports. (As shown in the chart below, real export growth had slowed even faster in recent quarters than the slowdown in world growth would have implied, potentially explaining some of the bounce-back in the third quarter.) The sensitivity of U.S. exports to foreign demand and the large contribution of exports to overall growth in the third quarter underscore both the importance of opening foreign markets to U.S. exports by passing the high-standards Trans-Pacific Partnership and the agreement’s potential to strengthen the U.S. economy as a whole.

 Chart3

  1. As oil prices have risen slightly in recent months, contractions in oil-related investment have weighed somewhat less on overall growth. The price of Brent crude oil was $31 per barrel in January 2016, nearly three-quarters lower than its recent peak in June 2014. While the decline in oil prices has benefitted consumers and the economy overall, it has weighed heavily on both mining and logging employment and on investment in mining exploration, shafts, and wells—which includes petroleum drilling structures—which declined by nearly two-thirds from the fourth quarter of 2014 through the second quarter of 2016. Partly as a result, overall structures investment subtracted an average of 0.2 percentage point from quarterly real GDP growth over this period. From its trough in January, however, the monthly price of Brent crude oil increased to $47 per barrel as of September, and the number of oil and natural gas rigs in operation (which reflects the rate of drilling for new oil and natural gas) has risen for five consecutive months. Consistent with the increase in oil prices, investment in mining exploration, shafts, and wells contracted more slowly in the third quarter of 2016 than in earlier quarters, and overall structures investment added 0.1 percentage point to GDP growth. Since both oil-related investment and employment tend to lag prices by several months, the recent moderation in oil prices may translate into a slowdown in the pace of employment losses and further slowing in the rate of contraction in mining exploration, shafts, and wells investment in future quarters.

 Chart4

  1. Real private domestic final purchases (PDFP)—the sum of consumption and fixed investment—rose 1.6 percent at an annual rate in the third quarter, a somewhat slower pace than in recent quarters. PDFP—which excludes more volatile components of GDP like net exports and inventory investment, as well as government spending—is generally a more reliable indicator of next-quarter GDP growth than current GDP. In the third quarter, the divergence between overall real GDP growth and the relatively weaker contribution of PDFP to growth was largely accounted for by the large positive contributions of inventory investment and exports to real GDP growth. Overall, PDFP rose 1.9 percent over the past four quarters, above the pace of GDP growth over the same period.

Chart5

As the Administration stresses every quarter, GDP figures can be volatile and are subject to substantial revision. Therefore, it is important not to read too much into any single report, and it is informative to consider each report in the context of other data as they become available.


Economy adds 156,000 Jobs in September; labor force participation rises; wages grow; real incomes rise at fastest pace since 1970s


WASHINGTON, DC – Jason Furman, Chairman of the Council of Economic Advisers, issued the following statement today on the employment situation in September. 

Summary: The economy added 156,000 jobs in September, as labor force participation rose and wages continued to grow.

The economy added 156,000 jobs in September, as the unemployment rate ticked up amid rising labor force participation. U.S. businesses have now added 15.3 million jobs since early 2010, and the longest streak of total job growth on record continued in September. So far in 2016, hourly earnings for private-sector workers have increased at an annual rate of 2.8 percent, much faster than the pace of inflation. In fact, real wages have grown faster over the current business cycle than in any since the early 1970s. Sustained real wage growth in recent years, combined with continued strength in job creation, has led to increased incomes for middle-class families: last month, the Census Bureau reported that real median household income increased 5.2 percent from 2014 to 2015, the fastest annual growth on record. Still, more work remains to sustain faster wage growth and to ensure that the benefits of the recovery are broadly shared, including increasing investment in infrastructure and implementing the high-standards Trans-Pacific Partnership. Additionally, as discussed in a new White House report, Congress should follow the lead of 18 States and the District of Columbia to give millions of American workers a raise by increasing the Federal minimum wage.

FIVE KEY POINTS ON THE LABOR MARKET IN SEPTEMBER 2016

1. U.S. businesses have now added 15.3 million jobs since private-sector job growth turned positive in early 2010. Today, we learned that private employment rose by 167,000 jobs in September. Total nonfarm employment rose by 156,000 jobs, slightly below the monthly average for 2016 so far but substantially higher than the pace of about 80,000 jobs per month that CEA estimates is necessary to maintain a low and stable unemployment rate given the impact of demographic trends on labor force participation. The unemployment rate ticked up to 5.0 percent in September, while the labor force participation rate rose to 62.9 percent, the same rate as in the fourth quarter of 2013 despite downward pressure on participation from demographic trends. The share of the labor force working part-time for economic reasons (those working part-time but who would prefer full-time employment) ticked down in September to 3.7 percent, though it remains above its pre-recession average (3.0 percent).

2. For more than three and a half years, American workers have seen sustained real wage gains, as hourly earnings have grown faster than inflation. So far in 2016, nominal earnings for private-sector workers have increased at an annual rate of 2.8 percent, well above the pace of inflation (1.4 percent as of August, the latest data available). As the chart below shows, nominal wage growth has trended up over the course of the recovery as the labor market continues to strengthen amid robust job growth. At the same time, consumer price inflation fell sharply in 2014 and 2015 due to steep declines in energy prices. While inflation has picked up slightly in recent months as energy price declines have moderated, nominal earnings growth has continued its pickup, translating into continued real wage gains for American workers—a key component of rising standards of living.

3. Real hourly wages have grown faster over the current business cycle than in any cycle since the early 1970s. The chart below plots the average annual growth of real hourly earnings for private production and nonsupervisory workers over each business cycle, including both recessions and recoveries. (Economists prefer comparing across entire business cycles, as they generally represent economically comparable periods.) Since the beginning of the current business cycle in December 2007, real wages have grown at a rate of 0.9 percent a year, faster than in any other cycle since 1973. In fact, since the end of 2012, real wages for non-managerial workers have grown 5.7 percent in total, exceeding the 2.1-percent total real wage growth from the business cycle peak in 1980 to the business cycle peak in 2007—a sign of the remarkable progress made by American families in the current recovery.

4. Rising real wages, combined with continued strong employment growth, have translated into increased incomes for American families, and data from 2016 so far point to continued gains. In September, the Census Bureau reported that real median household income increased by $2,800, or 5.2 percent, the largest annual increase on record. As shown in the chart below, median household income growth tends to track growth in aggregate weekly earnings, the total amount earned by private-sector workers. (Since both income and aggregate earnings reflect the influence of rising employment as well as rising wages, aggregate earnings are conceptually linked more closely to household income than to wages.) The historically large increase in median household income from 2014 to 2015 was far above what would have been predicted based on its historical relationship with aggregate earnings growth, but even aggregate earnings would have predicted strong gains in median income. In 2014 the situation was reversed, with the Census Bureau reporting income gains that fell short of what would have been predicted based on wage data from the Bureau of Labor Statistics. Growth in both real wages and employment so far in 2016 point to continued gains in real income for the typical American household when the data become available from the Census Bureau next year.

5. The distribution of job growth across industries in September diverged somewhat from the pattern over the past year. Above-average gains relative to the past year were seen in wholesale trade (+10,000) and other services (+15,000), while mining and logging (which includes oil extraction) showed no change in September after a number of months of job losses. On the other hand, several industries, including financial activities (+6,000), health care and social assistance (+22,000), State and local government (-15,000), and transportation and warehousing (-9,000) saw weaker-than-average growth. Slow global growth has continued to weigh on the manufacturing sector, which is more export-oriented than other industries and which posted a loss of 13,000 jobs in September.Across the 17 industries shown below, the correlation between the most recent one-month percent change and the average percent change over the last twelve months was 0.28, well below the average correlation over the last three years.

As the Administration stresses every month, the monthly employment and unemployment figures can be volatile, and payroll employment estimates can be subject to substantial revision. Therefore, it is important not to read too much into any one monthly report, and it is informative to consider each report in the context of other data as they become available.


New Figures Show Consumer Spending Had 2nd Fastest Growth Rate Since 2006, Supported by Rising Incomes

The White House issued this Fact Sheet about the third revision in second quarter economic growth estimates:

WASHINGTON, DC – Jason Furman, Chairman of the Council of Economic Advisers, issued the following statement today on the third estimate of GDP for the second quarter of 2016. You can view the statement HERE.

Summary: Real GDP growth in the second quarter was revised up to 1.4 percent at an annual rate according to BEA’s third estimate.   

Second-quarter economic growth was revised to 1.4 percent at an annual rate in the third estimate, up 0.3 percentage point from the second estimate. Consumer spending grew strongly at 4.3 percent in the second quarter—its second-fastest quarterly growth since 2006—and, in contrast to recent quarters, net exports and business fixed investment also added to GDP growth. Some of this growth was offset by a large decline in inventory investment (one of the most volatile components of GDP), along with declines in residential investment and government spending. Overall, growth in the most stable and persistent components of output—consumption and fixed investment—was revised up to 3.2 percent. Today’s report underscores that there is more work to do, and the President will continue to take steps to strengthen economic growth and boost living standards by promoting greater competition across the economy; supporting innovation; and calling on Congress to increase investments in infrastructure and to pass the high-standards Trans-Pacific Partnership.

FIVE KEY POINTS IN TODAY’S REPORT FROM THE BUREAU OF ECONOMIC ANALYSIS (BEA)

  1. Real Gross Domestic Product (GDP) increased 1.4 percent at an annual rate in the second quarter of 2016, according to BEA’s third estimate. Consumer spending grew 4.3 percent, well above its pace over the prior four quarters, with faster growth in both durable and nondurable goods spending. In addition, export growth was positive in the second quarter, and net exports contributed positively to GDP growth. Nonresidential fixed investment increased modestly in the second quarter, with strong growth in intellectual property products investment (see point 4 below) offset by continued weakness in both structures and equipment investment. Inventory investment—one of the most volatile components of GDP—subtracted 1.2 percentage points from GDP growth. Residential investment contracted following eight straight quarters of increases.

Real Gross Domestic Income (GDI)—an alternative measure of output—decreased 0.2 percent at an annual rate in the second quarter. (In theory, GDP and GDI should be equal, but in practice they usually differ because they use different data sources and methods.) The average of real GDP and real GDI, which CEA refers to as real Gross Domestic Output (GDO), increased 0.6 percent at an annual rate in the second quarter. CEA research suggests that GDO is a better measure of economic activity than GDP (though not typically stronger or weaker).


Chart1

  1. Second-quarter real GDP growth was revised up 0.3 percentage point, though the overall pattern of growth remained largely unchanged following revisions. Revisions in the third estimate included an upward revision to nonresidential fixed investment (which now is estimated to have made a positive contribution to GDP growth), reflecting a smaller contraction in structures investment than originally estimated. Smaller upward revisions to exports and inventory investment were partly offset by a small downward revision to the services component of consumer spending.

In today’s release, BEA revised down its estimate of real GDI growth in the second quarter from an increase of 0.2 percent to a decrease of 0.2 percent due to a downward revision to State-level data on indirect business taxes.

Chart2

  1. Real personal consumption expenditures, which account for over two-thirds of GDP, grew 4.3 percent at an annual rate in the second quarter, supported by rising real incomes. The second quarter of 2016 ranked as the second-strongest quarter for consumer spending growth since 2006. Consumer spending contributed 2.9 percentage points to GDP growth in the second quarter, reflecting improved economic conditions for many households. This month, the Census Bureau reported that real median household income increased 5.2 percent from 2014 to 2015, the fastest annual growth on record. Data from 2016—including a continued solid pace of job growth and a noticeable pickup in real hourly earnings—point to further strong gains in household incomes. The chart below shows four-quarter percent changes in real consumer spending and in aggregate real wages and salaries paid by domestic employers. The two series tend to move closely together, though the correlation between the two fell during the 2000s business cycle, as growth in consumer spending far outpaced growth in real aggregate wages and salaries. This was likely due to the rapid accumulation of household debt during this period, which sustained the faster growth in consumption. Deleveraging by households over the recession and the recovery has sharply increased the correlation of growth in wages and consumer spending in the current business cycle, such that recent gains in real incomes are likely to support continued strength in consumer spending growth in future quarters.

 Chart3

  1. Real private investment in research and development (R&D) made a larger contribution to GDP growth in the second quarter than in any previous quarter on record. Private R&D investment contributed 0.28 percentage point to overall GDP growth, accounting for most of the 9.0-percent growth in intellectual property products (IPP) investment and offsetting weakness in other components of business fixed investment. Private R&D investment grew at a 17.0-percent annual rate in the second quarter, the second-fastest quarterly growth since 1960. Private R&D investment has reached an all-time high as a share of overall output. Although this share (1.8 percent) is still relatively small, increased investment in R&D can help boost productivity growth in the future, which will be needed to help reverse the slowdown across advanced economies in the last decade.

Chart4

  1. Real private domestic final purchases (PDFP)—the sum of consumption and fixed investment—rose 3.2 percent at an annual rate in the second quarter, noticeably faster than overall GDP growth. PDFP—which excludes more volatile components of GDP like net exports and inventory investment, as well as government spending—is generally a more reliable indicator of next-quarter GDP growth than current GDP. In the second quarter, the divergence between the strong contribution of PDFP to growth and the relatively slower growth of overall real GDP was largely accounted for by the large negative contribution of inventory investment. Overall, PDFP rose 2.3 percent over the past four quarters, above the pace of GDP growth over the same period.

Chart5

As the Administration stresses every quarter, GDP figures can be volatile and are subject to substantial revision. Therefore, it is important not to read too much into any single report, and it is informative to consider each report in the context of other data as they become available.


Census Data: Household Income Grew at Record Pace; Poverty Rate Fell Fastest since 1968; Uninsured Rate Continued to Fall in 2015

WASHINGTON, DC – Jason Furman, Chairman of the Council of Economic Advisers; Sandra Black, Member of the Council of Economic Advisers; and Matt Fielder, Chief Economist of the Council of Economic Advisers; issued the following statement today on the Census Income, Poverty, and Health Insurance Data. You can view the statement HERE.

Summary: In 2015, household income grew at the fastest rate on record, the poverty rate fell faster than at any point since 1968, and the uninsured rate continued to fall. 

Today’s report from the Census Bureau shows the remarkable progress that American families have made as the recovery continues to strengthen. Real median household income grew 5.2 percent from 2014 to 2015, the fastest annual growth on record. Income grew for households across the income distribution, with the fastest growth among lower- and middle-income households. The number of people in poverty fell by 3.5 million, leading the poverty rate to fall from 14.8 percent to 13.5 percent, the largest one-year drop since 1968, with even larger improvements for African Americans, Hispanic Americans, and children. Meanwhile, the ratio of earnings for women working full-time, full-year to earnings for men working full-time, full-year increased to 80 percent in 2015, the highest on record. Every State has seen declines in its uninsured rate since 2013 as the major coverage provisions of the Affordable Care Act have taken effect. Solid employment growth and robust real wage growth so far this year suggest that incomes are continuing to rise in 2016, and, building on the progress shown in today’s Census report, the President will continue to call on Congress to take steps to invest in job creation, wage growth, and equal pay for equal work.

SIX KEY POINTS IN TODAY’S REPORT FROM THE CENSUS BUREAU

1. Real median household income rose by 5.2 percent in 2015, the fastest growth on record. Median household income grew $2,798 to $56,516 in 2015, the first time that annual real income growth exceeded 5 percent since the Census Bureau began reporting data on household income in 1967. Data from 2016 so far point to further strong gains in real household incomes, which depend on employment, nominal wages, and inflation. As of August, total nonfarm job growth has averaged a solid 182,000 jobs a month so far in 2016, and hourly earnings for private-sector workers have increased at an annual rate of 2.8 percent, much faster than the pace of inflation (1.3 percent as of July, the latest data available).

2. The total number of Americans below the poverty line fell by 3.5 million from 2014 to 2015, and the official poverty rate fell to 13.5 percent due to the largest one-year drop since 1968. The poverty rate for children under age 18 fell by 1.4 percentage point (p.p.) from 2014 to 2015, equivalent to more than 1 million children lifted out of poverty. Meanwhile, the poverty rate for those ages 18 to 64 saw its largest one-year decline on record (-1.1 p.p.), and poverty fell 1.1 p.p. for those ages 65 and older. As noted below (see point 5), the official poverty rate does not reflect the full effect of antipoverty policies because it includes only pre-tax income and excludes the direct effect of key policies like the Supplemental Nutrition Assistance Program (SNAP) and the Earned Income Tax Credit (EITC). The Supplemental Poverty Measure, which is designed to include the effects of these programs but also takes into the cost of basic needs when setting the poverty threshold, decreased 1.0 percentage point in 2015, from 15.3 percent to 14.3 percent.

3. Households at all income percentiles reported by the Census Bureau saw gains in income, with the largest gains among households at the bottom of the income distribution. While real median household income increased 5.2 percent, gains were even larger in the lower half of the income distribution, ranging from an increase of 5.5 percent for households at the 40th percentile to an increase of nearly 8 percent for households at the 10th percentile. While households at the top half of the income distribution also saw increases, their gains were smaller, with an increase of 2.9 percent in the 90th percentile of household income. 2015 marked the first time real household income grew at all percentiles reported by the Census Bureau since 2006, and real income growth in 2015 was the fastest since 1969 for the 10th, 20th, 40th, 50th, and 60thpercentiles. Although the level of income inequality remains high, multiple measures of inequality—including the Gini coefficient, the ratio of the 90th percentile of income to the 10th percentile, and the share of income going to households at the top of the income distribution—fell modestly in 2015 as a result of this pattern of income growth.

4. All racial and ethnic groups saw increases in household incomes and decreases in poverty in 2015. As shown in the chart below, all racial and ethnic groups saw gains in real median household income and reductions in their respective poverty rates. Hispanic Americans saw both the largest gains in median income (6.1 percent), while Black Americans and Hispanic Americans saw the largest reductions in poverty (-2.1 p.p. and -2.2 p.p., respectively). The Supplemental Poverty Measure (SPM), which includes the effects of a number of important antipoverty programs (see point 5 below), shows a similar pattern, with all racial and ethnic groups seeing reductions in poverty.

5. In 2015, refundable tax credits like the Earned Income Tax Credit (EITC) and the Child Tax Credit (CTC) lifted 4.8 million children out of poverty. The Supplemental Poverty Measure (SPM), which includes the effects of a large number of antipoverty programs, is widely acknowledged to measure poverty more accurately than the official measure. Unlike the official poverty measure, the SPM measures post-tax and post-transfer resources, combining earnings with assistance from government programs—including in-kind transfers like food assistance—minus net tax liabilities and necessary expenditures on work, child care, and health care. The measure also bases the poverty line on the cost of meeting basic expenses. Together, in 2015, 9.2 million Americans, including 4.8 million children, were lifted above the poverty line by refundable tax credits, including the EITC and the CTC, illustrating their critical importance to the social safety net. Additionally, research has shown that helping low-income working families through the EITC and CTC not only reduces poverty, but also has positive longer-term effects on children, including improved health, educational outcomes, and labor force participation and earnings in adulthood. Expansions to the EITC and CTC signed into law by President Obama as part of the American Recovery and Reinvestment Act of 2009 lifted 1.0 million children out of poverty in 2013 according to the Center on Budget and Policy Priorities; these provisions were made permanent under the bipartisan agreement at the end of 2015. The President’s Fiscal Year 2017 Budget includes a number of provisions to further strengthen tax credits for working families, including an expansion of the EITC to workers without qualifying children. (Note that some of these estimates rely on survey data, which research has shown tend to underreport household use of certain programs like the Supplemental Nutrition Assistance Program, leading to underestimates of the poverty-reducing effects of these programs.)

6. In 2015, the share of people without health insurance declined in almost every State, and all States have seen gains since 2013, reflecting continued progress under the Affordable Care Act (ACA). Today’s new data from the American Community Survey (ACS) show that 49 States and the District of Columbia saw their uninsured rates decline in 2015. The uninsured rate has fallen in every State (as well as in the District of Columbia) since 2013. While the ACS is not the first survey to report estimates of State-level insurance coverage in 2015, the survey’s extremely large sample size allows it to provide particularly reliable estimates.

While all States have seen increases in insurance coverage since the ACA’s major coverage provisions took effect in the beginning of 2014, the extent of those gains have varied widely by State. Notably, States that have expanded Medicaid under the ACA have seen larger coverage gains on average, particularly if they started with a larger uninsured population. If Medicaid non-expansion States had seen coverage gains comparable to those seen by Medicaid expansion states with similar uninsured rates, the uninsured rate in these states would have been nearly 3 percentage points lower in 2015, increasing the magnitude of these states’ coverage gains since 2013 by almost two-thirds.

Today’s Census release also included an estimate of the national change in the uninsured rate based on the Current Population Survey (CPS). According to the CPS, the national uninsured rate dropped by 1.3 percentage points from 10.4 percent in 2014 to 9.1 percent in 2015, bringing the cumulative gain since 2013 to 4.3 percentage points. The new data from the CPS are broadly consistent with evidence from other Federal and private surveys showing that coverage gains continued during 2015; those surveys show that gains have continued into early2016. The cumulative coverage gains since 2013 have put the uninsured rate at its lowest level ever.

Jason Furman is Chairman of the Council of Economic Advisers. Sandra Black is a Member of the Council of Economic Advisers. Matt Fiedler is Chief Economist of the Council of Economic Advisers.

White House: Economy Adds 151,000 Jobs in August; Unemployment Rate, Labor Force Participation Rate Hold Steady

Jobs 0816

WASHINGTON, DC – Jason Furman, Chairman of the Council of Economic Advisers, issued the following statement today on the employment situation in August. You can view the statement HERE.

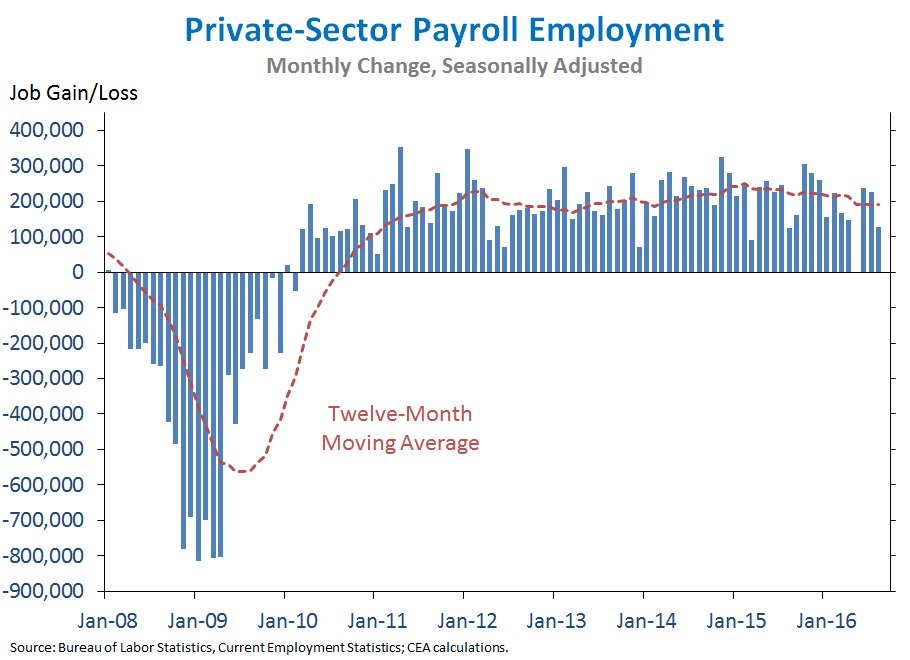
 The economy added 151,000 jobs in August following robust job growth in both June and July as the unemployment rate held steady at 4.9 percent. U.S. businesses have now added 15.1 million jobs since early 2010, and the longest streak of total job growth on record continued in August. So far in 2016, job growth has averaged a solid 182,000 jobs a month, well above the pace of about 80,000 jobs a month needed to maintain a low and stable unemployment rate, and hourly earnings for private-sector workers have increased at an annual rate of 2.8 percent, much faster than the pace of inflation. Nevertheless, more work remains to sustain faster wage growth and to ensure that the benefits of the recovery are broadly shared, including investing in infrastructure, implementing the high-standards Trans-Pacific Partnership, and raising the minimum wage. 

FIVE KEY POINTS ON THE LABOR MARKET IN AUGUST 2016

  1. U.S. businesses have now added 15.1 million jobs since private-sector job growth turned positive in early 2010.Today, we learned that private employment rose by 126,000 jobs in August, following a robust average gain of 232,000 jobs in June and July. Total nonfarm employment rose by 151,000 jobs in August, below the monthly average for 2016 so far but substantially higher than the pace of about 80,000 jobs per month that CEA estimates is necessary to maintain a low and stable unemployment rate given the impact of demographic trends on labor force participation.The unemployment rate held steady at 4.9 percent in August. The labor force participation rate remained at 62.8 percent, the same rate as in October 2013 despite downward pressure from demographic trends. So far in 2016, nominal earnings for private-sector workers have increased at an annual rate of 2.8 percent, well above the pace of inflation (1.3 percent as of July, the latest data available).
  2. As the labor market has strengthened, the share of employees quitting their jobs has recovered to roughly its pre-recession average.The quits rate tends to fall in recessions and rise in recoveries, since workers are generally more likely to choose to leave a job if there are job opportunities available elsewhere. As such, a higher quits rate is a sign of a stronger labor market. The chart below plots data from the Job Openings and Labor Turnover Survey (JOLTS) on both quits (voluntary separations) and layoffs and discharges (involuntary separations). The quits rate plummeted in the Great Recession as the layoffs and discharges rate rose sharply. Since then, as the labor market has recovered, the layoffs and discharges rate has fallen well below its pre-recession average, and the quits rate was near its pre-recession average as of June 2016 (the most recent data available). Nevertheless, the quits rate is still below its level in the early 2000s, part of a broader, decades-long trend ofdeclining labor market fluiditywhose causes and consequences continue to be debated by economists.
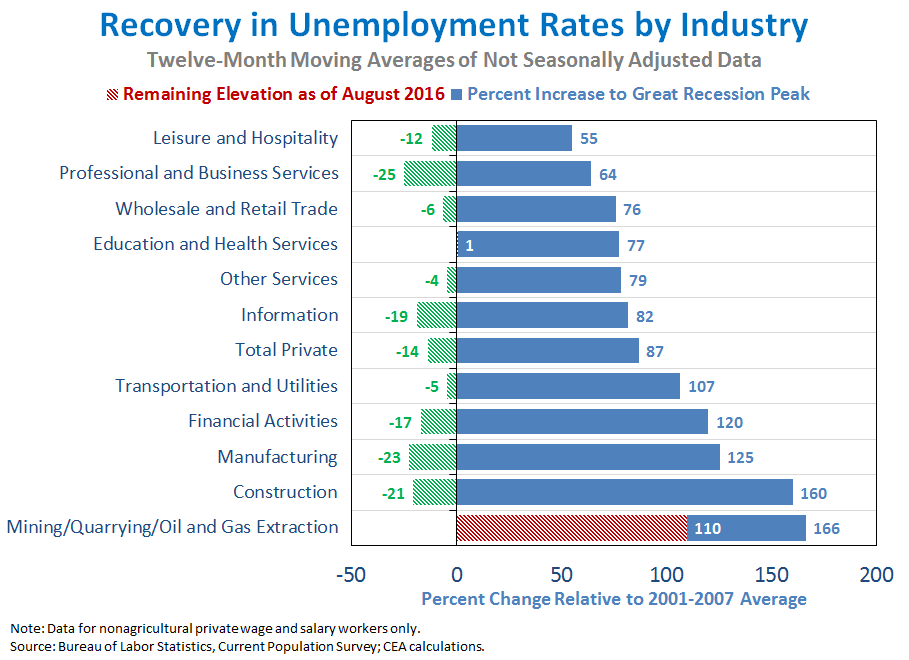
  3. Workers in nearly all private industries have seen their unemployment rates recover and fall below their pre-recession averages.The headline unemployment rate recovered to its pre-recession average of 5.3 percent in June 2015 and has since fallen even further, holding steady at 4.9 percent in August 2016. As shown in the chart below, the impact of the Great Recession varied across industries, with mining, quarrying, and oil and gas extraction workers, manufacturing workers, and construction workers in particular seeing large increases in their unemployment rates. As of August, however, unemployment rates for workers in 9 of the 11 major private industries have fallen below their respective pre-recession averages. The two exceptions are education and health services workers, whose unemployment rate has essentially recovered to its pre-recession average of 3.3 percent, and mining, quarrying, and oil and gas extraction workers, whose unemployment rate nearly recovered before increasing since mid-2014 amid falling oil prices and production (see point 4 below).Jobs 0816-2
  4. Employment in the mining and logging industry, which includes oil and gas extraction, has fallen sharply in recent months amid low oil prices.While the decline in oil priceshas benefitted consumers and the economy overall, it has weighed heavily on mining and logging employment, which has fallen by 25 percent since September 2014. Oil and gas workers make up more than half of the mining and logging industry; however, this sector represents just 0.5 percent of total U.S. nonfarm employment. The level of mining and logging employment is closely correlated with the price of oil, with shifts in employment usually following price changes, as the chart below shows. Since 2000, mining and logging employment has been most closely correlated with the price of oil eight months before, suggesting that the recent slight moderation in oil prices since the beginning of 2016 may translate into a slowdown in the pace of employment losses in the months ahead.
  5. The distribution of job growth across industries in August was broadly consistent with the pattern over the past year, though some industries saw below-trend growth.Above-average gains relative to the past year were seen in transportation and warehousing (+15,000) and State and local government (+24,000), while mining and logging (which includes oil extraction) posted a smaller loss (-4,000) than in recent months. On the other hand, several industries, including professional and business services (+25,000, excluding temporary help services), health care and social assistance (+36,000), private educational services (+2,000), and utilities (-1,000) saw weaker-than-average growth. Slow global growth has weighed on the manufacturing sector, which is more export-oriented than other industries and which posted a loss of 14,000 jobs in August.Across the 17 industries shown below, the correlation between the most recent one-month percent change and the average percent change over the last twelve months was 0.82, in line with the average correlation over the last year.

As the Administration stresses every month, the monthly employment and unemployment figures can be volatile, and payroll employment estimates can be subject to substantial revision. Therefore, it is important not to read too much into any one monthly report, and it is informative to consider each report in the context of other data as they become available.