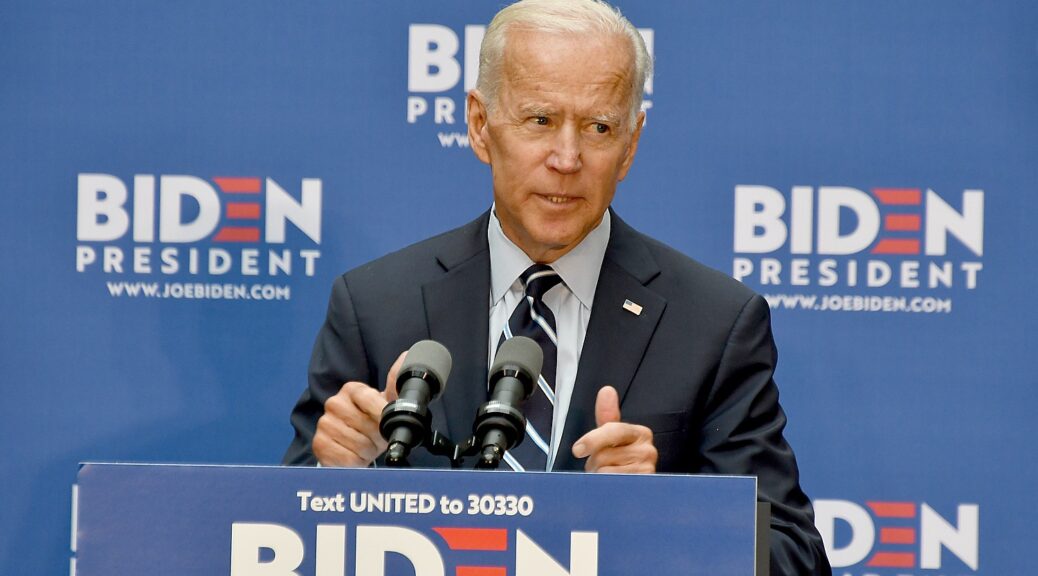
For Trump and the Republicans, the likely rise in homelessness because of mass evictions and foreclosures as a result of the economic collapse due to the coronavirus is another tool of voter suppression. Vice President Joe Biden, the presumptive Democratic candidate for president, is calling for an Emergency Housing Package (c) Karen Rubin/news-photos-features.com
Vice President Joe Biden, the presumptive Democratic candidate for president, calls out Trump and the Republicans for sitting by as 20 million Americans who have lost their jobs as a direct result of the coronavirus pandemic, now face eviction from their apartments, foreclosure from their homes (Treasury Secretary Steve Mnuchin made a fortune foreclosing on people in the 2008 Great Recession). The impacts of this collapse of family finances will follow for the rest of their lives, effectively canceling out the American Dream, if families can survive at all. I would submit what seems “merely”callous and indifferent to the suffering of so many is intentional. It is yet another tool in the Trump and Republicans’ campaign to suppress votes by likely Democratic voters – the more misery the better, but also, these voters can be challenged at the polls as no longer living where they were registered and unable to receive a vote-by-mail.
In contrast, Trump has elevated housing – fair housing – into another bullhorn call-out to his base. Just as he has done to sabotage Obamacare in the midst of a pandemic, he has rolled back an Obama-era rule – Affirmatively Furthering Fair Housing — that required local governments provide fair housing in order to receive federal housing funds. Trump tweet-gloated, not even bothering to code his meaning about who he was appealing to and why: “I am happy to inform all the people living their Suburban Lifestyle Dream that you will no longer be bothered or financially hurt by having low income housing built inyour neighborhood…Your housing prices will go up based on the market, and crime will go down. I have rescinded the Obama-Biden AFFH Rule. Enjoy!”
This is a statement from Vice President Biden on what a functioning federal response to such widespread homelessness should be: pass an emergency housing relief package –Karen Rubin/news-photos-features.com
Today is the first day of another month where rent and mortgage payments are due for millions of Americans who are already living on the edge. It comes a day after President Trump and Leader McConnell sent the Senate home for the weekend and allowed enhanced unemployment insurance, which millions of families have been using to pay their rent and bills, to lapse. And, the day after, we found out the last three months have been the worst period for our economy in recorded history. Hundreds of thousands of small businesses have shut their doors, with minority entrepreneurs especially hard hit. More than 30 million Americans are struggling to get by as their unemployment benefits are about to get sharply cut. Over the next two months, with no federal eviction moratorium in place, as many as 20 million families could find themselves out in the street without a safe place to live.
Because Donald Trump is abdicating his responsibility to lead us out of the pandemic crisis and the economic crisis, we now face a potential housing crisis across the country.
To prevent a catastrophic rise in evictions and homelessness, President Trump must work with Congress to act swiftly and enact a broad emergency housing support program for renters, just as we would in the aftermath of a natural disaster. Such a step would get help out quickly and at scale so that millions of people aren’t evicted or forced to choose between rent and food. Congress must also provide emergency unemployment benefits, greater access to food and nutrition programs, and full subsidies to allow families to keep their health insurance, so that the loss of one family member’s job doesn’t push the family into foreclosure and on the streets. This legislation must also include the fiscal relief necessary so state and local governments can keep on payroll the first responders, public school educators, and other public servants who ensure our cities and towns are clean, safe, and running.
Combined, these steps could put the nation in a much stronger position to handle the strain the virus is putting on millions of Americans and our entire economy. They are among many others we must take.
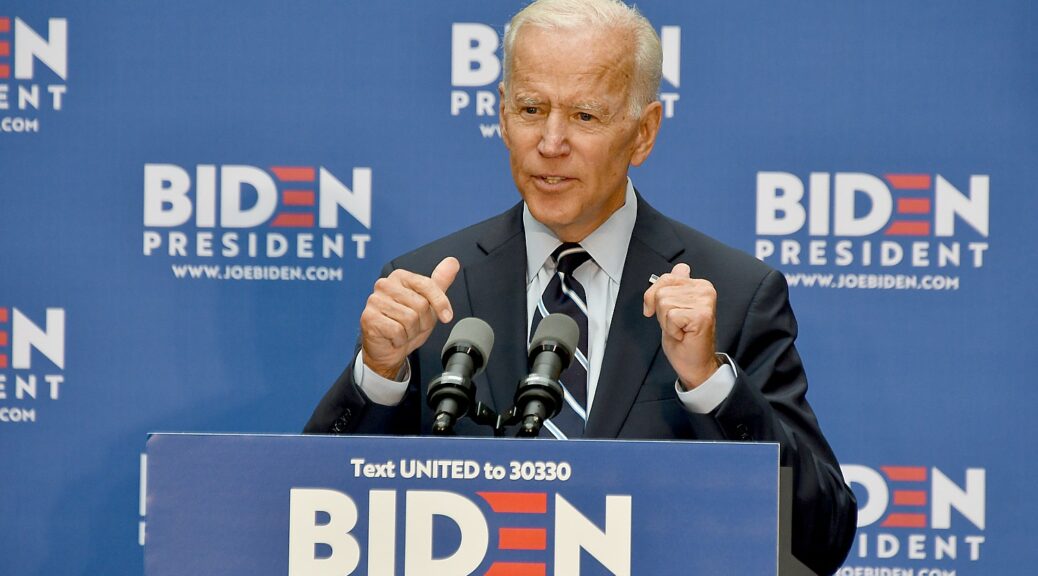
Vice President Joe Biden, the presumptive Democratic nominee for president, delivered remarks on the economy and the May jobs report which unexpectedly showed 2.5 million jobs added and an unemployment rate dipping slightly to 13.3%, instead of rising to as much as 20%. (c) Karen Rubin/news-photos-features.com
Vice President Joe Biden, the presumptive Democratic nominee for president, delivered remarks on the economy and the May jobs report which unexpectedly showed 2.5 million jobs added and an unemployment rate dipping slightly to 13.3%, instead of rising to as much as 20%. But that 2.5 million jobs reflects the fact that states have begun reopening; there were 40 million people who have filed for unemployment, so an unimaginable 37 million are still without jobs. And 13.3% is still higher than at any time during the 2008 Great Recession. Moreover, the Trump administration apparently changed the way certain numbers are calculated, so the actual unemployment rate could be 3 points higher, or 16.3%, which would be closer to what economists forecast. Trump also manages to ignore the fact that the stimulus program pushed by Democrats over Republicans’ objections, worked to keep the economy from descending into a Great Depression. He also ignored the disproportionate unemployment rates among Blacks and Hispanics, groups that are also suffering disproportionately from COVID-19. But Trump is desperate to put a rosy face on an economy while ignoring the fact the coronavirus pandemic is still spreading and his administration has done virtually nothing to provide a national program for testing, tracing and isolating, nor even set standards for workplaces and schools only some tepid guidelines. And Trump was desperate to shift attention from his Fascistic overreach of using military power used against peaceful protesters calling for an end to race-based police brutality.
Instead, Vice President Biden took Trump to task and offered his own analysis of the depth of harm to the economy and public health caused by Trump’s failure of leadership and his preoccupation with Wall Street over Main Street, wealth over wages.
Here is a transcript of Biden’s remarks: –Karen Rubin/news-photos-features.com
Good afternoon.
Before I speak to the economic situation, I have to take a moment to address something the President said this morning.
Toward the end of his remarks today, Donald Trump said he hopes that George Floyd “is looking down and seeing this is a great day for our country.”
He was speaking of a man who was brutally killed by an act of needless violence — and by a larger tide of injustice — that has metastasized on this President’s watch.
George Floyd’s last words — “I can’t breathe, I can’t breathe” — have echoed across our nation.
For the President to try to put any other words in the mouth of George Floyd — is frankly despicable.
And, the fact that he did so on a day when Black unemployment rose and black youth unemployment skyrocketed — tells you everything you need to know about who this man is and what he cares about.
Today, like all Americans, I was glad to see that two-and-a-half million Americans have gotten their jobs back.
For those families, that’s a sigh of relief.
And for all of us, it’s a reminder of the resilience of the American people.
To those Americans, I’m so proud of you, and so happy for you and your families.
I was disturbed, however, to see the President crowing this morning — basically hanging a “mission accomplished”’ banner when there is so much work to be done — and so many Americans are still hurting.
More than twenty million Americans — one out of every seven U.S. workers — are still out of work.
For an enormous swath of our country, their dreams are still on hold. They are still struggling to put food on the table. The unemployment rate remains the highest it’s been in nearly a century.
As I said, Black unemployment went up this month. Latino youth unemployment jumped to over 37 percent. Hispanic unemployment overall is four times higher than it was before the President botched his response to the pandemic. And I’m worried, when you look deeper at the data, that while temporary layoffs went down,permanent layoffs went up.
Donald Trump still doesn’t get it.
He’s out there spiking the football — completely oblivious to the tens of millions of people who are facing the greatest struggle of their lives. Those folks aren’t feeling any less pain today than they were yesterday.
People who’ve lost their health care in this crisis, they’re not celebrating today — especially when Donald Trump is still in court fighting to strip away health care protections from even more Americans.
The fact is, there are about 13 million less jobs today for American workers than the day that President Obama and I left office.
So while it’s wonderful to see ten percent of the families who lost their jobs due to Trump’s disastrous pandemic response start to make their way back — the President’s behavior makes me deeply worried for the 90 percent who haven’t.
So to all those families — who are scared, and hurting, and wondering what’s going to happen next: I want you to know I see you. I won’t ever forget you. And I won’t be satisfied – until this economy starts working for all of you.
Let’s be clear about something. The depth of this job crisis is not attributable to an act of God — but to the failure of a President. The truth is every country dealt with job losses due to the pandemic, but America was hit much harder out of the gate due to Trump’s complete mismanagement of the response.
This morning, he tried to compare our response to Germany’s and South Korea’s.
Okay, let’s compare. Germany has one-third of the deaths per capita that we do. South Korea has less than 300 deaths — total. America has four percent of the world’s population — and more than a quarter of the world’s deaths from this pandemic.
It’s no secret why that is.
Let’s get something straight: he did not act quickly.
For months, he downplayed the threat — falsely promising us that anyone could get a test — and claiming that “like a miracle it will disappear.”
He repeatedly praised China’s containment response – despite a litany of public appeals — including from me — not to bet American lives and the U.S. economy on the word of the Chinese government.
He refused to take action to get adequate testing in place — allowing the virus to spread further than it should have.
Columbia University found that 54,000 lives could have been saved if the administration had acted just two weeks earlier.
His failure didn’t just cost lives. It cost jobs.
New studies this week from Moody’s and Brookings confirm that half or more of those who lost their jobs would still be employed had Trump mounted a competent response like Germany and South Korea and other countries did.
We know why this happened. Donald Trump was more focused on the stock wealth of the biggest corporations than he was on the well-being of the American people.
It’s why he had his top economic advisors telling people to buy stocks instead of preparing our nation to brace for the pandemic.
Now — after 110,000 deaths and more than 20 million people still out of work — the consequences are clear.
We are still facing devastating unemployment, an historic health crisis, and a continuing crisis of violence, injustice, and indignity that is devastating Black Americans and diminishing the soul of our country.
These are some of the sternest challenges our nation has ever faced, and Trump is patting himself on the back.
He just has no idea what’s really going on in this country. He has no idea the depth of pain that people are facing. He remains completely oblivious to the human toll of his indifference. It is time for him to step out of his bunker and take a look around at the consequences of his words and actions.
Let’s be clear — a president who takes no responsibility for costing millions and millions of Americans their jobs deserves no credit when a fraction of them return.
But there’s a deeper concern here. As we recover, some of the temporary job losses we are still not on track to grow back in a way that will actually serve working people.
President Trump is still rewarding wealth over work.
All we hear coming out of the White House is calls for more tax cuts for big investors and big corporations. Well, they didn’t build this country. The middle class did — that’s who I fight for.
And if Trump continues to put the interests of CEOs and shareholders ahead of American workers, we’ll never get to where we need to be as a country.
Look, every American has a choice to make this November. Not simply what kind of President we want , but what kind of country we want. What kind of economy we want — and who that economy serves.
In the coming weeks, I will lay out in detail my comprehensive plan— not just to build things back to the way they were before COVID-19, but to build back better.
To create millions of new, good-paying jobs with benefits where people get a fair return for work and we make our country stronger, more resilient, and more just.
That plan will be anchored in job-creating investments, in small businesses, infrastructure – innovation, manufacturing, and caregiving, and in rewiring the faulty structures of our economy to ensure the dignity and equity of all American workers.
The public health crisis, the job crisis, and the crisis of inequity and indignity being endured by African Americans — those three challenges are deeply connected to one another.
The solutions must be, as well.
Any economic plan must start with a public health plan to make sure tests are available, to get our society functioning, to build back the confidence we need to truly bring back jobs and small businesses.
But that is only the first step.
My jobs plan will also be about restoring dignity to the American people.
In addition to pursuing badly-needed reforms, we need to be growing wages, leveling the playing field, and creating tens of millions of the new jobs we need to build a better American future.
There is a monumental amount of work to do to repair the damage that has been done. And simply tweeting slogans like “transition to greatness” won’t solve anything for families who are hurting.
I look forward to introducing and implementing a real jobs plan that will meet this challenging moment.
Americans can’t afford to have any more of their time wasted.
They need an economy that works for them — now.
They need jobs that bring dignity — now.
They need equal justice — and equal opportunities — now.
They need a president who cares about them, and cares about helping them heal — now.
MINNEAPOLIS, MN — Today, Senator Amy Klobuchar released a plan to prepare for and respond to the coronavirus in rural America.
As a senior member of the Senate Agriculture Committee, Senator Klobuchar has long been a leader in tackling the challenges that rural communities face. She believes our country needs to take immediate action to respond to the pandemic’s spread to rural America by strengthening rural hospitals and rural health care systems, supporting farmers and ensuring the continuity of the agricultural supply chain, and helping small businesses, workers and other critical aspects of the rural economy.
“We’re facing a national crisis — it affects every American, no matter where they live,” said Senator Amy Klobuchar. “While COVID-19 may be slower to spread to some rural areas, its impact will likely be just as serious, as we’ve seen in places like Albany, Georgia and Martin County, Minnesota. From expanding access to health care, to supporting farmers, to helping small businesses, we need to ensure that all communities across rural America are not left behind and have the resources they need to respond to this pandemic.”
Plan to Prepare For and Respond to the Coronavirus in Rural America
The coronavirus pandemic is a national crisis — it affects every American, no matter where they live. While COVID-19 may be slower to spread to some rural areas, its impact is expected to be as serious as it has been in urban areas. Rural Americans are more vulnerable to the virus but are often less able to access treatment. Rural Americans are more likely to be older and have serious chronic medical conditions — two of the greatest risk factors for severe illness from COVID-19. At the same time, people living in rural America are more likely to be poor and uninsured, making it difficult for them to afford treatment. And many rural hospitals and health care systems have fewer ICU beds and resources and could quickly become overwhelmed if they experience even a minor surge in critical patients.
Many rural communities are already facing these challenges. In Georgia, the rural city of Albany has been badly hit by pandemic — in early April it had one of the highest percentages of confirmed cases anywhere in the country and the National Guard has been deployed to help the local hospital. The town, whose residents are predominantly African American, also highlights the impact that our country’s response to the virus in rural America has on people of color — one in five rural Americans is a person of color or an indigenous person, and the coronavirus appears to be infecting and killing people of color at a disproportionately high rate.
In addition to the public health crisis rural communities are confronting, they are also facing an economic crisis. The farming and agriculture industry is seeing major disruptions due to the coronavirus, which will not only hurt rural areas, but could lead to higher food prices for consumers across the country. Small businesses, which are the backbone of many rural economies, are being hit hard, and rural workers are struggling to access child care, broadband, and many other critical services during the pandemic.
As a senior member of the Senate Agriculture Committee, Senator Klobuchar has long been a leader in tackling the challenges that rural communities face. She believes our country needs to take immediate action to respond to the pandemic’s spread to rural America by strengthening rural hospitals and rural health care systems, supporting farmers and ensuring the continuity of the agricultural supply chain, and helping small businesses, workers, and other critical aspects of the rural economy. The only way to beat this pandemic is to fight the virus together, and that means making sure that every community — from the biggest city to the smallest town — has the resources and support they need to respond to this crisis.
Rural Health Care
Rural health care systems are on the front lines of combating the coronavirus, but many are facing shortages of critical resources that they will need to treat patients — from ICU beds and ventilators, to doctors, nurses and other health care workers staffing the hospitals, to testing and personal protective equipment. We need to anticipate these challenges in areas that haven’t yet seen a surge in cases and make sure that we’re getting rural health care systems the support they need to keep people safe.
Rural Hospitals and Health Clinics
Provide rural hospitals the resources they need to confront the pandemic. Rural hospitals, including Critical Access Hospitals, provide essential medical services to rural communities, but they also often have smaller operating margins than larger hospitals. Right now, they face added financial pressure due to increased expenditures to prepare for an influx of patients with COVID-19 at the same time they have had to cancel elective procedures, which are normally a major source of revenue. We need to take action to make sure these hospitals remain able to serve rural communities, especially during this crisis. Senator Klobuchar is calling for an expedited process with dedicated support for Critical Access Hospitals and other rural hospitals to immediately receive grants and loans they need to purchase supplies, modify their facilities, and pay their staff. She is pushing for an expansion of the $100 billion Public Health and Social Services Emergency Fund so that funding is available for hospitals that are likely to experience a surge of patients later in the crisis, including many in rural America. She is also calling for a longer timeline for repayment and other necessary flexibility under the Medicare Accelerated Payments Program so rural hospitals have the time they need to regain their financial footing and she is calling for changes to ensure that small publicly-owned hospitals are eligible for the Payment Protection Program. In addition, Senator Klobuchar has championed legislation to help hospitals in rural areas stay open by creating a new Rural Emergency Hospital classification under Medicare to give hospitals more support if they maintain an emergency room and provide outpatient services. She also supports providing ongoing financial relief by making the suspension of the two percent Medicare automatic reimbursement cut permanent for rural hospitals and considering what other temporary relief may need to be extended to allow rural hospitals to recover financially from the impact of the pandemic.
Temporarily reopen recently closed rural hospitals when possible. Senator Klobuchar is calling for the Department of Health and Human Services to explore funding and regulatory flexibility to temporarily reopen some of the over 120 rural hospitals that have closed in the last decade. Temporarily reopened facilities could help provide overflow support to hospitals that have reached capacity and provide an option for basic levels of care for rural residents to limit pressure on larger hospitals.
Support rural health clinics. Many rural communities don’t have easy access to a hospital and instead rely on rural clinics for their health care. We need to make sure that these clinics have the resources they need to effectively diagnose and treat patients who may not need to be hospitalized, or who come to them before hospitalization. Senator Klobuchar is calling for increased support for the USDA’s Community Facilities Direct Loan and Grant Program, additional support for community health centers — over half of which are in rural areas — and specifically targeting additional small business assistance to health care providers. To strengthen the long-term financial health of rural health care providers, Senator Klobuchar supports adjusting Medicare’s geographic practice cost index to reflect the actual costs of providing health care in rural areas.
Health Care Workers and Supplies
Strengthen the rural health care workforce. On average, rural areas have half as many physicians per capita as urban areas, and rural areas face shortages of nurses, physicians assistants, specialists, and other medical providers. Senator Klobuchar is calling on the Department of Health and Human Services to provide the maximum possible flexibility to rural health providers to develop adaptable staffing plans to respond to increased demand and compensate for workers who may become sick or need to isolate. She has also called on the Department of Homeland Security to provide additional flexibility for foreign medical workers in the United States on temporary visas. Many health care workers in rural areas are also facing challenges with child care, especially in child care deserts that already have a shortage of child care facilities. Senator Klobuchar is calling for dedicated funding to set up temporary child care facilities for health care and other critical workers in child care deserts. To address rural workforce shortages more broadly, Senator Klobuchar supports building on the Conrad 30 program that allows international doctors trained in the United States to extend their stay in the country if they agree to practice in underserved communities. She also supports expanding student loan forgiveness programs for health care and long-term care workers practicing in underserved areas.
Ensure rural areas have access to necessary medical supplies and testing. Medical facilities across the country face a shortage of necessary medical supplies including personal protective equipment, testing supplies, hospital beds, and ventilators. As competition for supplies has intensified, rural health providers, with less available cash and smaller economies of scale, are at a significant disadvantage. Senator Klobuchar is calling for additional funding to hospitals to purchase these critical supplies and specific consideration of the needs of rural areas when designing federal, state, and regional supply distribution strategies and when allocating equipment from the National Strategic Stockpile.
Health Policies that Work for Rural America
Target public health messages for rural areas. The coronavirus pandemic is a national crisis and public health communications should reflect all parts of the country. Senator Klobuchar is calling for consistent and targeted messages from public health agencies to highlight the importance of preparation and prevention in rural areas. Public health officials also need to provide practical information to those living in rural areas who cannot stay at home for financial, medical or safety reasons and may need to continue to travel significant distances during the pandemic.
Address racial disparities in health outcomes. Senator Klobuchar is calling for the Department of Health and Human Services to provide rural health systems information and tools they need to address racial disparities in health outcomes from coronavirus. She has also called on the Centers for Disease Control and Prevention to provide demographic and racial data about the impact of coronavirus and for the Administration to increase outreach to minority communities disproportionately impacted by the virus, including those living in rural areas.
Increase regional collaboration. Small rural health care providers are less likely to have additional resources to reallocate internally to respond to sudden increases in demand or shortages of personnel and equipment. Senator Klobuchar is calling for the Department of Health and Human Services to develop best practices for local regional cooperation among health care providers during the pandemic. She will also push for needed regulatory flexibility and additional funding for the Hospital Preparedness Program to facilitate cooperative agreements.
Expand access to telehealth and virtual visits. Telehealth services can protect patients and providers from exposure to coronavirus while still responding to patients’ medical needs. This is even more important in rural areas where patients could otherwise have to travel long distances to receive care, further increasing the possibility of exposure and transmission. To build on the temporary flexibility already provided for some telehealth services, Senator Klobuchar is leading bipartisan legislation to expand telehealth programs and support access to technology for virtual visits to help protect vulnerable populations from possible exposure to the virus. She also supports permanently reforming Medicare telehealth rules that unfairly limit coverage and reimbursement so that rural communities can continue to benefit from strong telehealth options after the pandemic.
Farmers and Agriculture
Spring is a critical planting and harvesting time for many American farmers, and they are facing major disruptions due to the pandemic. If farmers are unable to plant their crops or get their goods to market, that could devastate many rural economies and hurt consumers, who will see higher prices for their food at a time when budgets are already stretched too thin. We need to make sure that we are providing farmers and farm workers with the support they need to survive this crisis and continue to get food to Americans across the country who need it.
Immediate Support for Farmers
Provide farmers financial relief. The coronavirus pandemic is causing new disruptions across the agricultural sector for producers who have already been dealing with persistently low commodity prices, economic uncertainty, and tight farm lending regulations. Senator Klobuchar has called for the Farm Service Agency to provide clear guidance, consider targeted loan forgiveness measures, and expand efforts to ensure farmers have reliable access to credit. She is calling on USDA to fully use the Agricultural Mediation Program to resolve credit issues in a way that works for both farmers and lenders. Senator Klobuchar is also calling for the Small Business Administration to allow for the broadest possible access to the Paycheck Protection Program and the Economic Injury Disaster Loans in rural America, including by allowing Farm Credit System institutions to serve as lenders where many farmers and rural businesses have already established relationships. Building off bipartisan legislation led by Senator Klobuchar that was recently passed into law to expand access to Chapter 12 bankruptcy for family farmers, Senator Klobuchar is also calling for outreach to farmers about eligibility for and the benefits of this option, which allows family farmers to reorganize and keep the farm after falling on hard times.
Address low commodity prices. As a senior member of the Agriculture Committee, Senator Klobuchar worked to write and pass three farm bills with strong farm safety nets for our farmers. These safety nets are more important than ever as farmers, ranchers and other agricultural producers are facing direct losses from disruptions caused by the coronavirus pandemic and futures for most agricultural products indicate that these losses are likely to continue. These losses are being experienced across the board with reports of dairy farmers suffering $5.7 billion in losses in the last five weeks, hog producers estimating they will lose $37 per pig for the remainder of the year, and cattle ranchers facing a 30 percent loss to the value of their cattle since the beginning of the year. Senator Klobuchar is calling for additional short-term support to producers as needed through dedicated disaster funding and the Commodities Credit Corporation. To provide stability for farmers as they recover from the effects of the pandemic, Senator Klobuchar is calling for indexing farm safety net support levels to reflect changes in our country’s cost of production, low commodity prices, and loss of global market access. She is also calling for fully funding permanent disaster programs and improving support levels, loan rates and program delivery. Senator Klobuchar also is pushing for improving and expanding commodity support and federal crop insurance programs and increasing the average premium subsidy for crop insurance.
Protecting Farm Workers
Protect farm workers and food processors on the job. Workers on farms and at food processing facilities often work in crowded conditions that present an opportunity for the spread of coronavirus. Senator Klobuchar is calling for updated Occupational Safety and Health Administration rules to keep these workers safe, increased training on best practices available in appropriate languages, and support for farms and businesses to provide appropriate personal protective equipment to employees and adjust their operations to lower the likelihood of coronavirus transmission among their workers. The closure of the Smithfield Foods processing plant in Sioux Falls, South Dakota, demonstrates how the lack of national testing and public health response can disrupt food supplies and put workers at risk.
Support health and safety for agricultural workers. Many agricultural workers lack access to health care and housing appropriate for social distancing or quarantining. Senator Klobuchar is calling for increased support for the National Center for Farmworker Health and other programs at the Health Resources and Services Administration that support farm worker health. In addition, she is calling for emergency housing for agricultural workers to limit the spread of the virus among workers at home, provide a safe place for workers who need to self quarantine, and to make it easier for unemployed Americans to relocate to areas where agricultural jobs may be available. She is also calling on the Administration to provide clear, long-term guidance that will allow immigration programs for temporary farm workers to operate at a level consistent with past years even as consular services are reduced.
Ensuring the Continuity of the Supply Chain
Ensure the continuity of the food supply chain. Complex supply chains connect farmers to consumers. Disruptions in any portion of the supply chain can ripple through and create additional challenges for producers or shortages for consumers, especially when it comes to highly perishable products such as fruits and vegetables. Among others, truck drivers play a critical role in this supply chain. Senator Klobuchar is calling for actions to protect the safety of workers throughout the supply chain and minimize disruptions of interstate freight operations. That means clear federal standards and enforcement for employee health and safety, exemptions from travel restrictions for workers critical to supply chains, temporary flexibility on commercial drivers license renewals, and efforts to maintain rest areas and other services important to the safety of commercial vehicle operators. She also is calling for emergency funding for ports and other intermodal facilities that may see temporary reductions in demand but will be essential for responding to shifting supply chains as the pandemic progresses. She is calling for additional flexibility for USDA inspectors to increase the use of virtual certifications and overtime as necessary to compensate for inspectors who are sick or quarantined.
Help producers transition to new supply chains. Some producers who normally sell to commercial food services operators or farmers markets and need to temporarily find new supply chains to connect them to grocery stores and other customers facing increased demand. Senator Klobuchar is calling for increased support for establishing alternate supply chains including through programs such as the Value-Added Producer Grant program, Local Agriculture Market Program, and Regional Food System Partnerships.
Responding to Changing Demand for Food and Fuel
Promote food security. As unemployment rises and many families face reduced incomes, demand for nutritional assistance from the federal government and charitable organizations is increasing. Senator Klobuchar is calling for expanding the maximum Supplemental Nutrition Assistance Program (SNAP) benefit, increasing the size of the benefit provided for teenage family members and expanding the Summer Electronic Benefit Transfer for Children. These policies should be made permanent as recommended in a National Academies of Science Report on how to reduce child poverty by half in ten years, but at minimum they need to be extended through the duration of the economic recovery that will follow the immediate health emergency. Senator Klobuchar is calling for the Administration to authorize the use of the Disaster Household Distribution nationwide to provide increased flexibility to food banks during the pandemic. She is also urging the Administration to end rulemakings currently in progress that make it harder to qualify for SNAP by restricting categorical eligibility, changing the way utility costs are calculated, and giving states less flexibility during times of high unemployment.
Support homegrown energy. Senator Klobuchar believes that homegrown biofuels are key to our rural economies, our nation’s energy security, and reducing greenhouse gas emissions. She has been a leader when it comes to standing up to the Administration’s misuse of small refinery renewable fuel standard (RFS) waivers, and she authored an amendment that was included in the Farm Bill that provides mandatory funding to support biobased marketing and manufacturing. As demand for fuel has dramatically declined, many biofuel producers are being forced to idle plants and layoff workers. Senator Klobuchar is calling for temporary relief for the biofuels sector from the Commodity Credit Corporation. In addition, to strengthen the long-term outlook for biofuel production in the United States, Senator Klobuchar supports strengthening the RFS, promoting the use of blender bumps, passing a law to ensure year-round E-15 sales, and extending the biodiesel and second generation biofuels tax credits.
Rural Workers and Businesses
Like the rest of America, rural economies are getting hit hard by this crisis. Many rural workers and businesses will face unique challenges getting back on their feet, and we need to make sure that they are getting the support they need to make it through the pandemic.
A Path to Recovery for Small Businesses
Provide small businesses the relief they need. Small businesses are the lifeblood of many rural communities, and are being hit extremely hard during this pandemic. If small businesses in rural America close for good, entire towns will suffer. That’s why Senator Klobuchar, along with Senators Chris Coons and Ben Cardin, secured a provision in the CARES Act that provides six months of relief on SBA loan payments for 320,000 small businesses — but more needs to be done. Senator Klobuchar is calling for an expansion of the Paycheck Protection Program created in the CARES Act to provide sufficient funding to get rural small businesses through the crisis. She is also calling for targeted tax relief to allow businesses to preserve cash and additional relief for businesses struggling with rent, mortgage, and insurance premiums. She has also introduced legislation to create a Treasury Department program to partner with states and private investors to help fund new businesses in parts of the country that have a shortage of equity investments in new businesses, with a focus on businesses founded by women and people of color.
Increase technical assistance for small businesses. The number and complexity of programs designed to provide support for small businesses can make access assistance difficult in some instances. Many small businesses in rural areas work closely with community banks and credit unions who are well positioned to provide advice based on their understanding of local conditions. That’s why Senator Klobuchar supports reserving a portion of future small business relief for distribution through community-based financial institutions. She is also calling on the Small Business Administration to make sure their outreach and education efforts reach small businesses in rural areas and address their needs and for Congress to provide additional support for nonprofit organizations assisting small businesses to retain staff.
Provide ongoing support to rural small businesses. Small businesses in rural areas face additional obstacles in accessing credit because many traditional lenders do not have the infrastructure and experience to effectively serve rural America. Senator Klobuchar is calling for expanding and strengthening USDA’s Business and Industry Loan Guarantee Program and the Rural Business Investment Program and continued support for the Farm Credit System. Senator Klobuchar will strengthen USDA programs that support entrepreneurs like the Value-Added Producer Grants, Rural Microentrepreneur Assistance Program, Intermediary Relending Program, and Agricultural Innovation Centers. She will push to reauthorize the New Market Tax Credit and make sure it effectively serves rural America.
Ensure federal investments reach communities suffering from decades of neglect. When it comes to long-term economic development investments to help communities recover from the economic crisis caused by the pandemic, Senator Klobuchar is calling for adopting Congressman Jim Clyburn’s 10–20–30 plan, which Senator Cory Booker has also led in the Senate, in which 10 percent of federal resources are committed to communities where at least 20 percent of the population has been living below the poverty line for 30 years or more, many of which are in rural areas.
Standing up for Rural Workers
Support the service sector. While agriculture is a significant part of rural economies, the service sector actually employs the largest number of workers in rural counties — and these jobs are being hit hard by the crisis. We need to make sure these workers are able to continue to make ends meet and provide for their families during and after the pandemic. The CARES Act included critical relief for workers — including direct cash payments, expanded unemployment insurance that covers self-employed workers and gig workers, and temporary relief for borrowers with federal student loans — but more needs to be done. Senator Klobuchar is calling for expanding paid leave to cover additional workers, enforceable standards from the Occupational Safety and Health Administration to protect workers from exposure to coronavirus, and making sure rural businesses of all sizes can access support and incentives to retain and rehire workers.
Expand access to child care. Rural communities experience unique challenges when it comes to child care, as nearly two-thirds of rural families live in a child care desert, meaning an area where there are at least three young children for every licensed child care slot — or no licensed child care providers at all. The closure of schools has created additional challenges for essential workers who need to find child care while they provide critical services. Senator Klobuchar is calling for expanding assistance in rural areas by further increasing funding for the Child Care and Development Block Grant and increasing the subsidy rate so that rural child care providers can more easily meet their operating expenses and increase the quality of their programs. She also supports limiting child care payments to 7 percent of a family’s income and making targeted investments to build the supply of licensed child care in rural child care deserts.
Living in Rural America
From the lack of broadband access to child care deserts, living in rural America during this pandemic can pose unique challenges. We need to take action to make sure that families in rural communities have the resources they need to continue to live their lives during this pandemic.
Ensuring Families Have the Resources to Succeed
Improve broadband access. Roughly one in four rural Americans say access to high-speed internet is a major problem. Access to broadband increases options for employment, health care, education, and staying in touch with loved ones during the pandemic. During a time when schools are switching their classes to distance learning, rural and low-income students without broadband access are at a particular disadvantage. We must make sure that rural and low-income families have access to resources to help them access broadband. That’s why Senator Klobuchar has introduced legislation to provide $2 billion for a new Keeping Critical Connections Emergency Fund to help connect low-income families and students who have switched to distance learning by compensating small providers who offer free or discounted broadband services or upgrades. She has also called for additional funding for the E-Rate program, including support to provide WiFi hotspots to students without broadband connections.
Support rural education. Rural school districts typically have fewer students, face higher transportation costs and have fewer options for professional development compared to urban school districts. Senator Klobuchar is calling for formulas, flexibility, and guidance for federal and state support to school districts that take into account the unique needs of rural districts to ensure they receive equitable funding. She is also calling for additional support for rural school districts that are distributing meals to students who are unable to pick them up at school, including working with local agricultural producers to incorporate fresh food when possible.
Increase support for affordable housing. Before the beginning of the coronavirus pandemic, 54 million Americans lived in rural areas with a severe need for more affordable rental housing. With millions of Americans facing unemployment through no fault of their own, even more Americans are now likely to need housing assistance. Senator Klobuchar is calling for strong enforcement of the temporary moratorium on evictions for properties with federally-backed mortgages and an extension of the moratorium if economic conditions have not significantly improved by the time it is set to expire. She will also push for any emergency rental assistance funding to be fairly distributed to renters living in rural areas. Senator Klobuchar also supports strengthening rural rental assistance programs and significantly increasing investments in the rural housing supply by the federal government and through incentives to private lenders.
Maintaining Important Government Services
Support local governments. Many rural counties and municipalities already faced tight budgets before the pandemic. Now they are spending money to change how services are delivered during the pandemic and are seeing higher levels of demand for many services. At the same time, sources of revenue such as sales taxes are declining. Since many of these governments also have smaller workforces, any absences due to illness or quarantine can also have a disproportionate effect on their ability to provide essential services. Senator Klobuchar is calling for additional federal support for local governments, including direct federal support for smaller and rural local governments. .
Maintain a reliable Postal Service. A reliable Postal Service providing consistent mail delivery has always been important in rural areas, including for mail-order prescription drugs, and is even more important when people are staying home and practicing social distancing. However, the steep decline in mail volume caused by the pandemic, combined with ongoing financial difficulties, has created a crisis for the Postal Service. Senator Klobuchar is calling for immediate financial relief for the Postal Service and increased flexibility for the Postal Service to respond to workforce shortages caused by the coronavirus while maintaining the highest possible delivery standards that prioritize medical deliveries and account for the needs of rural America. She will also continue to stand up against attempts to privatize this essential public service.
Protect consumers from bad actors. While most Americans are coming together to do our part to fight the pandemic, some bad actors are using the crisis to take advantage of people. There are widespread reports of price gouging, which can be a particular problem in rural America where consumers are less likely to be able to find alternative vendors for the supplies they need. To address this, Senator Klobuchar has introduced legislation to outlaw price gouging during pandemics, natural disasters, and other emergencies and to empower the Federal Trade Commission (FTC) to fine those trying to unfairly profit off of disasters. There are also increasing reports of scams, especially those targeting seniors. Senator Klobuchar has called on the FTC to step up its education and enforcement efforts to stop scammers, and she leads bipartisan legislation in the Senate to give the FTC additional tools to prevent and respond to fraud targeting seniors.
Cuomo: “My last point is practice
humanity. We don’t talk about practicing humanity, but now if ever there is a
time to practice humanity the time is now. The time is now to show some
kindness, to show some compassion to people, show some gentility – even as a
New Yorker.”
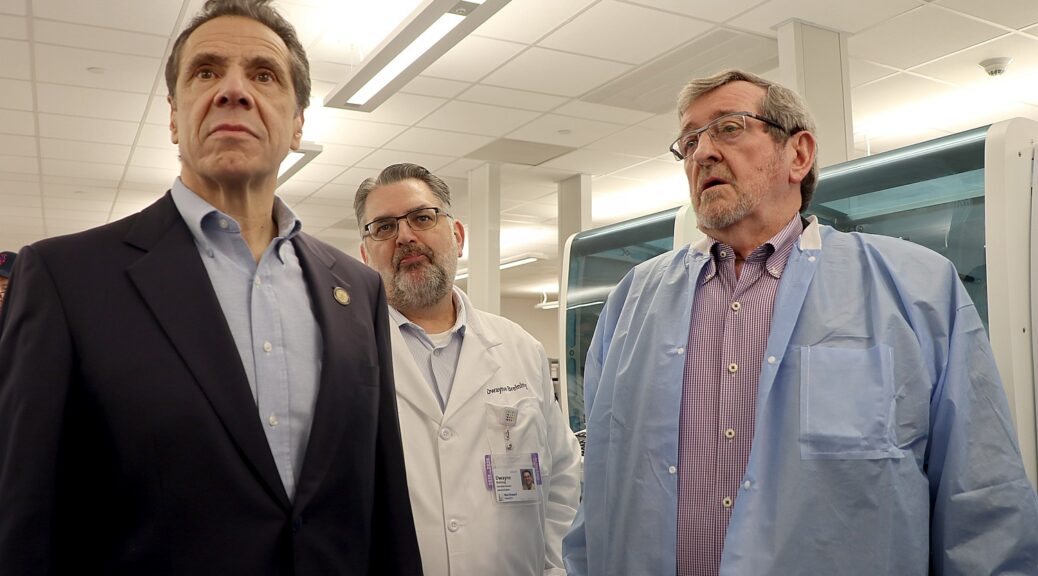
Trump has played a pathetic game of catch-up to the actual task of getting Americans through the coronavirus pandemic as best as possible, with as few deaths and as little destruction to the economy and society as possible. While he has proved a mendacious inept clog, true leadership has been demonstrated by Governors, especially New York Governor Andrew Cuomo. His press availability today, in which he gave updates on his nonstop effort to increase hospital capacity and obtain necessary protective equipment and medical supplies in anticipation of a surge of patients, was heartening to New Yorkers. It was a speech that hearkened to Franklin Delano Roosevelt, who was Governor of New York before he was President, leading the nation through the Great Depression and later through World War II. This is a rush transcript of the Governor’s remarks:
Good morning. Happy Saturday.
Welcome to the weekend. I want to give you an update and briefing on where we
are today and then we’re going to go out and do some real work, get out of this
building before we get cabin fever. You know the people who are here today.
From my far right, Simonida Subotic who is in charge of managing
supplies which is a major function for us, Robert Mujica, Director of
Division of the Budget, Melissa DeRosa, Secretary to the Governor, the
great James Malatras who has been a tremendous help here.
Go through the facts, the numbers
are still increasing. We have been seeing that. That’s the line that we’re
tracking. This is all about the increase in the number of cases and managing
the increase in the number of cases to the capacity of our health care system.
What are we doing? We’re reducing the spread and the rate of the spread to
match the increase in the number of cases and increasing hospital capacity at
the same time – just how do our hospitals manage the rate of the
spread.
We’re trying to reduce the spread
to over a period of months. Over a period of months our healthcare system can
deal with the numbers. We have moved to zero non-essential workers. You can’t
go below zero so we’re doing everything we can there and we put out new rules
on personal conduct and what people should be doing and how they should be
behaving and where they should be.
Matilda’s Law which is for the
vulnerable population, senior citizens, people with compromised immune systems,
underlying illnesses – that was very specific. As I mentioned we named it for
my mother Matilda because I went through this with my own siblings. How do we
help mom? Where do we bring mom? There was a difference of opinion. The best
health professionals put together guidelines that not only help senior citizens
but also their families who are trying to deal with this. I know it was helpful
to my family and the question among siblings these laws and guidelines
answered. I don’t want to mention which sibling but it turns out that he was
wrong.
The personal conduct rules and regulations are also very helpful. I want to thank Dr. Fauci who is really an extraordinary American and has given me great guidance and help and assistance in putting together these policies so I’d like to thank him and we’re doing those.
We’re working on every level. Every pistol is firing. Everything that can be done is being done. New Yorkers are lucky. We have a very experienced team that’s doing this. This is not their first rodeo. They’ve been through a number of emergencies on a number of levels.
Increasing hospital capacity – we want to get the capacity of 50,000 thousand up to a
minimum of 75,000. We told the hospitals we’re going to be ending elective
surgeries. We are now working with hospitals to reconfigure the space in the
hospital to get more beds and to find more staff to manage those beds. We’re
working on building new beds. We’re going to go out and review a number of
sites today. I’d like to give the final list to the federal government and the
Army Corps of Engineers today but we’re looking at Javits, SUNY Stony
Brook, SUNY Westbury, the Westchester Convention Center, and I’m going to go
out and take a look at those sites today or the ones I can get to. That would
give us a regional distribution and a real capacity if we can get them up
quickly enough and then increasing supplies which is one of the most critical
activities.
We are literally scouting the globe looking for medical
supplies. We’ve identified 2 million N-95
masks which are the high protection masks. We have apparel companies that are
converting to mask manufacturing companies in the State of New York in all
sorts of creative configurations and I want to thank them. I put out a plea
yesterday to ask them for help and we’ve been on the phone with all sorts of
companies who are really doing great work. We’re also exploring the State
of New York manufacturing masks ourselves.
We’re going to send 1 million N95 masks to New York City
today. That’s been a priority for New York
City and 1 million masks won’t get us through the crisis but it’ll make a
significant contribution to New York City’s mask issue and I want to thank
Mayor de Blasio for working in partnership. We’re sending 500,000 N95 masks to
Long Island. We’ve been working with County Executive Laura Curran and County
Executive Steve Bellone and I want to thank them.
We’re gathering ventilators. Ventilators are the most important piece of equipment and
the piece of equipment that is most scarce. We’re gathering them from all
different health facilities across the state and then we’re going to use those
in the most critical areas. We also identified 6,000 new ventilators that we
can actually purchase so that’s a big deal.
From the federal government’s
point of view I’ve spoken to the President a number of times. I spoke to the
Vice President a number of times. They’ve issued a federal disaster declaration
which is a technical act by the federal government but what it basically does
is it allows the federal emergency management agency called FEMA to step in and
assist financially. By that declaration FEMA
would pay 75 percent of the cost of a disaster. New York State would pay 25
percent of the cost. The federal government can waive the 25 percent of the
cost. I’m asking them to waive that 25 percent in this situation. I’ve
worked on many disasters, FEMA has waived the 25 percent. If there’s any
situation where FEMA should waive the 25 percent, this is the situation.
We’re also working with the federal government. We’re
requesting 4 field hospitals at 250 capacity each. That would give us 1000
field hospital beds. We’re going to
be looking at Javits as a location for those field hospitals.
We’re also requesting 4 Army Corps of Engineers temporary hospitals. Those are
the sites I mentioned earlier that I’m going to take a look at. The
SUNY Stonybrook, Westbury, Westchester Convention Center and
also Javits. Javits is so big that it can take the 4 field
hospitals and an Army Corps of Engineers temporary hospital. We’re also
requesting assistance with medical supplies which has been a very big
topic of conversation all across the country.
We’re also asking our
federal congressional delegation to fix a law that was passed on the
coronavirus federal aid because of a technical issue the way the bill was
written, New York State does not qualify for aid. That’s over $6
billion, that is a lot of money and we need the federal delegation to fix that
bill otherwise New York State gets nothing. New York State has more coronavirus
cases than any state in the United States of America. That we should not be
included in the bill, obviously makes no sense.
We’re also going to conduct immediately trials for the new
drug therapy which we have been discussing.
I spoke to Dr. Zucker about it. There is a theory that the drug treatment
could be helpful. We have people who are in serious condition and Dr.
Zucker feels comfortable, as well as a number of other health professionals,
that in a situation where a person is in dire circumstance, try what
you can. The FDA is going to accelerate to New York 10,000 doses. As
soon as we get those doses we will work with doctors, nurses and families on
using those drugs and seeing where we get.
I spoke to the President, he spoke
to this drug therapy in his press conference yesterday and I spoke to him
afterward. I said that New York would be interested and we have the most number
of cases and health professionals have all recommended to me that we try it, so
we’ll try it. We’re also
working on a number of other drug therapies, an anti-body
therapy, a possible vaccine. We have a company here
in New York called Regeneron that’s really showing some
promising results. I exempted them from the no work order, because they couldn’t possibly have a
really significant achievement for us. The new numbers, the more tests you
take, the more positives you find, and I give this caution because I think
people misinterpret the number of new cases. They take that number of new cases
as if it is reflective of the number of new cases, the spread. It is not. The
number of new cases is only reflective of the number of cases you are taking,
right. Where our goal is to find the positive cases, because if we find a
positive case we can isolate that person, and that stops the spread. So we’re
actually looking for positives. The more tests you take, the more positives you
will find.
We are taking more tests in New York than anyplace else.
We’re taking more tests per capita than China or South Korea. We’re also taking
more tests than any state in the United States of America. That is actually a great accomplishment. Because if you
remember back, two weeks, which seems like a lifetime now, the whole question
was coming up to scale on tests. How do we get the number of tests up and how
do we get it up quickly? I spoke to the president and the vice president and
said decentralize the testing, let the states do it. I have 200 labs. I can
mobilize quickly. Let us do the tests. They agreed. We’re doing more tests than
any state, so for example, we’ve done
45,000 tests. California has done 23,000, Washington has done 23,000, so
you see how many more tests we are doing. And again, I credit the team that’s
working here, because this is exactly what the mandate was. Perform as many
tests as quickly as you can, and that’s the drive-thrus we’ve put in
place, the hospital management, et cetera. So our numbers should be higher. And
they are.
Total number of positive cases now is up to 10,000,
number of new cases has increased by 3,000, let’s go back in case you can’t
read as fast as I can read. 6,000 New York City, 1,300 Westchester, 1,200 in
Nassau. You see the Westchester number
is slowing. We did a New Rochelle containment area. The numbers would suggest
that that has been helpful. So I feel good about that. You see Nassau
increasing, you see Suffolk increasing. So that’s just the wide spread increase
that we have been anticipating. But our hotspot of Westchester is now slowing,
and that’s very good news. New York City, it is the
most dense environment. This virus spreads in density, right. And
that’s what you’re seeing in New York City, obviously, has many more people
than any other specific location in the state. Number of counties are
increasing. You see the blue. I said to you early on that blue is going to take
over the whole state, just the way every state in the United States has now
been covered. Most impacted states, you look at the cases in New York is
10,000, Washington, California, 1,000 each. Does that mean that we have ten
times the number of cases as California or Washington? Or does that mean
we’re doing more tests than California or Washington? The truth is somewhere in
the middle, and nobody can tell you. Total number of people tested, we’re up to
45,000. Number of new tests. This is a rate that we watch. What is the rate of
hospitalization? Again, because this is all about hospital capacity, right, 1,500
out of 10,000, it’s roughly 15 percent of the cases. It’s been running about
14, 15. It’s gone as high as 20 percent, 21 percent. So actually 15 percent
rate of hospitalization is not a bad number. It’s actually down from where it
was. The more refined number is, of those who are hospitalized, how many
require the ventilators, because the ventilators are the piece of equipment
that is most scarce. That’s the next refinement of these numbers that we have
to do.
And again, the context on the
numbers is important. We’re talking 10,000 et cetera. You look at any world
health organization or the NIH, or what any of the other countries are saying.
You have to expect that at the end of
the day, 40 percent to 80 percent of the population is going to be infected. So
the only question is, how fast is the rate to that 40 percent, 80 percent,
and can you slow that rate so your hospital system can deal with it. That is
all we’re talking about here. If you look at the 40 to 80 percent, that means
between 7.8 million and 15 million New Yorkers will be affected at the end of
the day. We’re just trying to postpone the end of the day. Again,
perspective, Johns Hopkins, this is not a science fiction movie. You don’t have
to wait to the end of the movie to find out what happens. Johns Hopkins has
studied every case since it started, 284,000, 11,000 deaths, almost 90,000
recoveries, 183,000 still pending. Which tracks everything we know in the State
of New York. Our first case, first case, healthcare worker, 39-year-old female
who was in Iran. She went home, she never went to a hospital, she
recovered, she’s now negative. You get sick, you get
symptoms, you recover. That is true for the overwhelming number of
people. Again, context, people who died in the flu, from the flu, in 2018-2019:
34,000 Americans. 34,000, so when you hear these numbers of deaths, keep it in
perspective. 34,000 people died of the flu. Over 65, 74 percent of the people
were over 65. 25 percent were under 65. So, if you have an underlying illness,
you catch the flu, you can die. More likely if you have an underlying illness,
senior citizens, et cetera, but not necessarily. You have 25 percent under 65
years old die from the flu.
Also, in terms of context,
perspective. Don’t listen to rumors. I
mean, you have such wild rumors out there, and people call me with the craziest
theories. Just, I understand there’s anxiety and stress, but let’s remember
some basic context and facts. Society
functions. Everything works. There’s going to be food in the grocery stores.
There’s no reason to buy a hundred rolls of toilet paper. There really isn’t.
And by the way, where do you even put a hundred rolls of toilet paper? The transportation system functions. The
pharmacy system functions. These things are all going to work. Nonessential
workers, stay home, but the essential workers are staying home, especially the
healthcare workers. There is not going to be any roadblock when you wake up in
the morning that says you can’t leave this place, you can’t leave that place,
right? So if you have a real question, because you think there’s a real concern
from a credible source, contact my team. We have a special website: coronavirus.health.ny.gov, and ask the question
and you will get a real, truthful, factual response.
I have not hidden anything from the people of this state.
I have not tilted facts. Franklin Delano
Roosevelt, the American people deserve the truth, they can handle the truth,
give them the truth. When they don’t get the truth and if you don’t get the
facts, that’s when people should get anxious. If I think I’m being deceived or
there’s something you’re not telling me, or you’re shading the truth, now I’m
anxious. Everything I know, I’ve told you, and I will continue to tell you, and
these are facts, and you hear a rumor, and you want to check it out, go to that
website, these are people who work for me directly, and you will have the
truth. We do have an issue with
younger people who are not complying, and I’ve mentioned it before but it’s not
getting better. You know, you can have your own opinion. You cannot have your
own facts – you want to have an opinion, have an opinion, but you can’t have
your own facts. “Well young people don’t get this disease.” You are
wrong – that is not a fact. 18-49 years
old are 54 percent of the cases in New York State. 54 percent. 18-49 years old.
So you’re not Superman, and you’re not Superwoman, you can get this virus and
you can transfer the virus and you can wind up hurting someone who you love or
hurting someone wholly inadvertently. Social distancing works and you need
social distancing everywhere. There’s a significant amount of
non-compliance, especially in New York City, especially in the parks – I’m
going to go down there today, I want to see what situation is myself, but it
has to be stopped because you are endangering people and if it’s because of
misinformation, if it’s because of noncompliance, I don’t care frankly – this
is a public health issue and you cannot endanger other people’s health. You shouldn’t be endangering your own. But
you certainly have no right to endanger someone else’s.
This is my personal opinion, this is not a fact, you know to me it’s very important in
a situation like this, tell me the facts and then tell me your opinion – this
is my opinion. We talk about social
responsibility, especially young people talk about social responsibility and
they should – we pass a lot of legislation in this building, groundbreaking
legislation, national firsts, on economic rights, highest minimum wage in the
United States of America, human rights, first state to pass marriage equality,
which I believe was a human rights issue, we talk about environmental
responsibility and this state has the most aggressive environmental laws in the
United States of America and I am proud of it, but I also want people to think
about the social responsibility when it comes to public health. We haven’t
talked about it before, not really a field, it’s not really an issue, it’s not
really a hashtag, but social responsibility applies to public health just as it
applies to human rights, and economic rights and environmental rights – public
health, especially in a moment like this, is probably most critical.
So let’s think about that and
let’s act on that. In this crisis, think of yourselves, we are all first responders – your actions can either save or endanger
a life, so we are all first responders. What’s going to happen? We’re going
to get through this. We don’t know how long it’s going to take us to get
through this. Fact is we’re trying to
slow the spread of the virus to a number of months so the healthcare system can
deal with it, so therefore by definition it’s going to be a number of months.
I know people want to hear, “It’s only going to be a matter of weeks and
then it’s going to be fine.” I
don’t believe it’s going to be a matter of weeks. I believe it is going to be a
matter of months, but we are going to get through it, and how long and how well
it takes us to get through it is up to us. It depends on what we do – you
know when you’re sick and you say to the doctor, “Well how long until I
get better?” And the doctor says, “It depends on what you do. If
you follow the advice, you’ll get healthy faster, but it depends on what you
do.” This depends on what we do. China is now reporting no news cases.
Let’s assume that’s true – look at that trajectory, look at that turnaround,
look at what they did, we do have data we can follow. So how long is it going
to take? It depends on how smart and how we responsible are and how diligent we
are. You tell me the percentage of compliance and intelligence and discipline
on social disciplining et cetera? I’ll tell you how long it takes for us to get
through it.
Also something that people aren’t really talking about but I think we should start talking about – we talk about the economic consequences of this situation and they are going to be significant, and we are going to have to deal with it and New York will be right on top of it and as aggressive as we are witheverything else. But economic consequences come second – first, is dealing with this crisis. We talk about the economic consequences but we also need to talk about the social consequences. There is no Dow Jones index that we can watch on the screen that is measuring the social consequences and the social decline. But the stress, the anxiety, the emotions that are provoked by this crisis are truly significant, and people are struggling with the emotions as much as they are struggling with the economics. And this state wants to start to address that. I’m asking psychiatrists, psychologists, therapists who are willing to volunteer their time to contact the state and if this works out I would like to set up a voluntary network where people can go for mental health assistance where they can contact a professional to talk through how they are feeling about this. They are nervous, they are anxious, they are isolated. It can bring all sorts of emotions and feelings to the surface. When you are isolated you do not have people to talk to.
So I am asking the professional mental health establishment to contact us. Let us know that you are willing to volunteer time. It would obviously be all electronic. It would not be in person. It would be telephone, it would be Skype, etc. But I would ask you to seriously consider this. Many people are doing extraordinary things during this public health crisis. I ask the mental health community, many of them are looking for a way to participate, this is a way to participate. And if we get enough mental health professionals willing to volunteer their time, we will set up a mental health electronic help center. And we will talk more about that the next few days.
What happens besides how long?
What happens? The bigger question to me
is what do we learn about ourselves through this? As a society, we have
never gone through this. We have never gone through a world war. We have not
gone through any great social crisis. Here in New York, we went through 9/11
which I think is relevant in terms of some feelings that people are now
experiencing. 9/11 transformed society. I was there. I was part of it. You were
never the same after 9/11. You had a sense of vulnerability that you never had
before which I feel to this day. There was a trauma to 9/11. But as a society,
as a country, we have been blessed in that we have not gone through something
as disruptive as this.
So what do we learn about ourselves? I think what we are saying already is a crisis really
brings out the truth about ourselves first of all and about others. And your
see people’s strengths and you see people’s weaknesses. You see society’s
strengths and you see society’s weaknesses. You see both the beauty and
the vulnerability. You see the best in people and you see the worst in people.
You see people rise to the occasion and you see people fall from the burden of
the emotion. So, I think – You take a step back.
BURLINGTON, Vt. – Sen. Bernie Sanders gave remarks regarding the lessons we can learn from the growing coronavirus outbreak.This is a rushed transcript provided by the Sanders campaign:
Good afternoon everyone, thank you for being here. In the midst of a major healthcare and economic crisis currently facing our country, I’d like to take a few minutes to talk about the lessons we can learn long-term about what we are experiencing today.
As I discussed yesterday, our country is facing, as everybody knows, a medical and economic crisis, the likes of which we have not seen for generations. And we must prepare for this response in an unprecedented way, making certain that our government responds effectively, and protects the interests of all our people regardless of their income, or where they live. In other words, this is not just about giving tax breaks to large corporations, but about remembering the people today who don’t have much money, who are nervous about their economic futures and healthcare prospects.
Needless
to say we must massively increase the availability of test kits for the coronavirus and the speed at which the tests are
processed. We need to anticipate significant increases in hospital admissions, which means that we will need more
ICU units and ventilators, we will need more
doctors, nurses, and medical personnel of all kinds – and we must make sure
that these frontline personnel are well
protected from the diseases they are treating. I have talked to nurses
recently who worry very much about whether they are getting the kind of
knowledge and equipment they need so that they do not get sick.
We need to significantly improve
our communications and collaboration with other countries to ensure that we
are learning everything that we can about the successes and failures of other
countries as they deal with this crisis. And furthermore, we must be honest with the American people and
communicate as effectively and directly as we can with all of the scientific
information that we can provide.
Further, and most importantly, our
response to this entire crisis must be guided by the decisions of doctors,
scientists, and researchers, not politicians.
But as we struggle with this crisis, it is also important that we learn
the lessons of how we got to where we are today, and what we must do in the
future so that we are better prepared for similar crises that may come.
Poll after poll already shows us that the American people understand
that we must do what every other major country on earth does, and that is to guarantee healthcare to all of our people
as a human right, not a privilege. As we begin to see the failures and
vulnerabilities of the current healthcare system, my guess is that those
numbers and the demand for universal healthcare will only go up.
The American people are asking: how is it possible that we spend twice as much per capita as
the people of Canada and other major countries, while 87 million of us are uninsured or underinsured.
And obviously, in this crisis, and unbelievably, it means that people
who are sick today, people who woke up this morning with symptoms of the
coronavirus, are saying, “you know I feel sick but I cannot afford to go to a doctor.” And when somebody is
not treated for the virus – somebody who is unable to afford to go to that
doctor – that means that that infection can spread to many others, putting us
at risk.
So it’s not just
a question that in normal times – tragically, unbelievably – that we lose 30,000 people a year because they
don’t get to doctor on time, but now the lack of healthcare threatens other
people as well.
How could it be, that when we spend so much more than what other countries are spending, we have millions of people who may be dealing with the virus but they cannot go to the doctor because they can’t afford it? That is a question that must resonate in every American’s mind.
If this isn’t a red flag for the current
dysfunctional and wasteful healthcare system, frankly I don’t know what is.
For the benefit of all of us, we must make sure that every person in
this country who needs to seek medical treatment can go to a doctor free of
charge regardless of their income. That is obviously what we must do now in the
middle of a crisis, but it is what we must do as a nation in the near future.
Here are just a few instances about how absurd and dysfunctional our
current healthcare system is.
It has been estimated that a full battery of tests for the coronavirus costs over $1,300. First of all,
take a look at that – $1,300 to get the test people need to have to know if
they have the virus or not.
In America today, 40% of our
people don’t have $400 in the bank to pay for an emergency expense. We
have half of our people living paycheck to paycheck.
If their car breaks down they can’t afford to get it fixed, and if
somebody tells them it costs $1,300 for the test to determine whether you have
the coronavirus if they’re sick, what are they supposed to do? What happens to
them?
How can someone without insurance afford to pay $1,331 to get tested when they don’t even have $400 in the bank? What are they supposed to do? What happens to them? Do they go to a payday lender where the average interest rate is over 390%? Do they borrow money from their family? Or do they go without the test? Which every doctor in the world will tell them is a test they should have.
And while the Trump administration says it may cover co-pays to cover
the cost of testing for those who have insurance, they will not cover the cost of treatment – which could cost tens of
thousands of dollars.
How cruel is that? How absurd is that? To say to people, “we’re sorry
you have coronavirus, we covered the cost of the test, but now you’re on your
own and it’s going to cost tens of thousands of dollars to get treated.” That
is totally absurd.
Clearly what we need to do is to make sure that if someone has the
coronavirus that person gets the treatment that they need.
In other
words, our current system leaves people uninsured, but even if you have
insurance you may not even have the ability to travel to a doctor near you.
Because now we’re talking about a system in which many rural hospitals have closed down and
they cannot find a doctor in their communities.
The reality today, and this is an issue we must to deal with, is that we don’t have enough doctors, we don’t have
enough hospitals, and we don’t have enough clinics in rural communities and
inner cities.
Further, we are in a situation when we desperately need affordable prescription drugs, yet we have a
pharmaceutical industry that continues to make billions in profits by charging
outrageous prices for prescription drugs, sometimes 10x more in this country than in other countries.
In my view,
the most cost effective way to reform our dysfunctional and cruel system is to
move to a Medicare for All, single-payer healthcare system.
And I think in the midst of this crisis, more and more Americans
understand the truth of that.
It is nearly impossible to
believe that anyone can still think it’s acceptable to continue with a
healthcare system that leaves tens of millions of people uninsured. The cruelty
and absurdity of that view is more obvious in the midst of this crisis than it
has ever been.
And let’s be clear. Lack of
healthcare and affordable medicine does not only threaten the healthcare and
well-being of the uninsured. It threatens everyone who comes in contact with
them.
In fact, what this crisis is beginning to teach us is that we are only as safe as the least insured
person in America.
Further, we are the only major
country on earth that does not mandate paid family and medical leave. And
we’re seeing how that crisis is impacting where we are today.
As we speak, there are millions of workers — right now — who are
being told to go to work, yet they may be ill and should be staying home.
But these very same families
will face financial ruin if they don’t go to work. These are workers in the
restaurant industry, transportation industry, tourism, retail — in other words
the people who interact with the public every single day.
Right now, at a time when half of our people live paycheck to paycheck,
and at a time of massive wealth and income inequality, we must directly address the economic desperation facing a
huge number of Americans.
So we must finally pass a paid
family leave program in the United States to keep this virus from spreading
and to keep Americans healthy.
We must do it right now.
People should not be going to work when they are sick, it is unfair to
them, it is unfair to the people they are in contact with. And yet, that
reality exists, because we are the only major country on earth not to guarantee
paid family leave and sick time.
Finally, from a national
security perspective, it is
incomprehensible that we are dependent on China and other countries for masks,
for prescription drugs, for rubber gloves, and for key parts needed to make
advanced medical equipment like ventilators.
As a result of
globalization and our disastrous trade policies, we have been outsourcing
millions of jobs and factories overseas that have gutted our economy. Now we
are seeing another tragic and devastating result of those policies, as we find
ourselves dependent on other countries to provide the most essential things we
need to combat a pandemic and protect the lives of the people in our country.
Now trade is
a good thing, but it has to be based on common sense principles. It has to
be based on protecting American workers
and protecting our national security, making sure we are producing what we need
in this country in the event of a national crisis.
Now is the time to begin
bringing back production and manufacturing to the United States and enact fair
trade policies so that we are never in this position again.
Now here is the bottom line. As we are dealing with this crisis, we
need to listen to the scientists, to the
researchers, and to the medical professionals, not politicians.
We need to move quickly to prepare for the exponential increase of
cases we will be seeing here in our country.
But as we do that, we must begin thinking about how, as a society, we
can create a healthcare and economic system that is humane, that is compassionate,
and that works for all people, not just the wealthiest.
Now that is an issue that people have had to think about for a long
time, but I think in this moment of
crisis more and more people understand that we need fundamental changes to our
economy, and we need fundamental changes to our healthcare system.
As Donald Trump departed the White House to attend the G7 after
a day in which he attacked Federal Reserve Chairman Jay Powell as a “worse
enemy” than China’s Chairman Xi and ordered US companies to leave China, a day
in which the Dow plummeted 600 points, a day after he referred to himself as the
“Chosen One” as he looked to the heavens and demanded that Russia be invited
back into the G8, Vice President Joe Biden, candidate for the Democratic
nomination for president, issued this statement:
“This week, in the lead-up to the G7 in
France, President Trump has continued his irrational and self-defeating
campaign to make America less secure and less respected in the world. He
has insulted our closest partners and denigrated one of our most capable
allies, Denmark—a country that has repeatedly fought and sacrificed alongside
our troops. He issued yet another attack on NATO, reiterating his belief that
NATO is an American-run protection racket where our allies better pay up, or
else. And he advocated for Russia’s return to the G7, despite Vladimir Putin’s
long and growing record of aggressive behavior and provocations against the
United States and our allies in Europe.
“Trump’s actions and words are not just embarrassing—they are making the
American people less safe. Every incident further isolates us on the global
stage, reinforcing that his version of “America First” means America alone. For
the first time in its history, the G7 will not even issue a joint communique,
because President Trump refuses to cooperate with our partners on the pressing
issues of our time, including climate change, China’s predatory trade
practices, Russian attacks on western democracies, and nuclear proliferation.
No country, even one as powerful as ours, can go it alone against 21st century
challenges that respect no borders and cannot be contained by walls.
“NATO, the most powerful alliance in history, is the bulwark of America’s
national security and the free world’s first line of defense. It’s how we
amplify our own strength, maintain our presence around the globe, and magnify
our impact – while sharing the burden among willing partners. NATO is an
alliance built first and foremost on shared democratic values, which makes it
more durable and more reliable than partnerships built on coercion or cash. But
it is not indestructible, and Trump has taken a battering ram to our most
important strategic alliance.
“More than two-and-a-half years into his presidency, the pattern of
Trump’s conduct and character is clear. He never misses a chance to lavish
praise on dictators like Putin and Kim Jong Un, and takes every opportunity to
bash our closest democratic allies. Instead of leading alongside fellow
democracies, he seems to be on the other team. His incompetence threatens to
permanently reduce America’s standing and, consequently, our capacity to bring
together nations to address shared challenges. This will change when I am
president. We will restore the soul of this nation. And we will once again lead
the international community in a way that is consistent with our most cherished
values, standing with—not against—the rest of the free world.”
With Donald Trump continuing to rewrite history, advance falsehoods about Obama’s Presidency, it is important to examine the Employment report for November. Trumpsters depend upon disaffection and dissatisfaction. A strong economy is the antithesis. Also, Trump wants to take credit as the forward momentum of Obama’s policies continue on into the new administration, before the administration’s policies, undoing everything Obama accomplished, have their impact.
Trump was able to exploit years of propaganda from the Republicans aimed at destroying his presidency. Obama found a way to thread the needle in coming up with solutions, despite unprecedented obstruction of infrastructure spending, the America Jobs Act, spending for transportation and highways, defeating his plans to build high-speed rail and invest in clean, renewable energy.
Obama was almost a victim of his own success – like President Bill Clinton before him, who presided over a golden era of peace and prosperity, when everyone’s income and standard of living rose, only to see Al Gore denied the presidency – people take for granted how much better they are off from when Obama took office, when 850,000 jobs a month were being lost, 20,000 people a month were losing their health care, millions were losing their homes to foreclosure.
Obama also had in place programs to help the people who found themselves unable to pursue the 5.5 million unfilled jobs because of lack of training. He had programs to boost advanced manufacture, and open up markets to the 95% of the world that is outside the US.
Trump is profiting from being handed a growing economy, and he has signaled he will install the very same people who profited from millions of Americans misery, he will undo the financial and consumer protections, he will throw people back into the insecurity of losing health insurance and jobs and homes. He has shown in his appointments and in his business record that he will exploit workers and further weaken unions.
Statement on the Employment Situation in November
WASHINGTON, DC – Jason Furman, Chairman of the Council of Economic Advisers, issued the following statement today on the employment situation in November.
Summary: The economy added 178,000 jobs in November, extending the longest streak of total job growth on record, as the unemployment rate fell to 4.6 percent.
The economy added a solid 178,000 jobs in November as the longest streak of total job growth on record continued. U.S. businesses have now added 15.6 million jobs since early 2010. The unemployment rate fell to 4.6 percent in November, its lowest level since August 2007, and the broadest measure of underemployment fell for the second month in a row. Average hourly earnings for private employees have increased at an annual rate of 2.7 percent so far in 2016, faster than the pace of inflation. Nevertheless, more work remains to ensure that the benefits of the recovery are broadly shared, including opening new markets to U.S. exports; taking steps to spur competition to benefit consumers, workers, and entrepreneurs; and raising the minimum wage.
FIVE KEY POINTS ON THE LABOR MARKET IN NOVEMBER 2016
1. U.S. businesses have now added 15.6 million jobs since private-sector job growth turned positive in early 2010. Today, we learned that private employment rose by 156,000 jobs in November. Total nonfarm employment rose by 178,000 jobs, in line with the monthly average for 2016 so far and substantially higher than the pace of about 80,000 jobs per month that CEA estimates is necessary to maintain a low and stable unemployment rate given the impact of demographic trends on labor force participation.
In November, the unemployment rate fell to 4.6 percent, its lowest level since August 2007. The labor force participation rate ticked down, though it is largely unchanged over the last three years (see point 3 below). The U-6 rate, the broadest official measure of labor underutilization fell 0.2 percentage point for the second month in a row in part due to a reduction in the number of employees working part-time for economic reasons. (The U-6 rate is the only official measure of underutilization that has not already fallen below its pre-recession average.) So far in 2016, nominal hourly earnings for private-sector workers have increased at an annual rate of 2.7 percent, faster than the pace of inflation (1.6 percent as of October, the most recent data available).
2. New CEA analysis finds that State minimum wage increases since 2013 contributed to substantial wage increases for workers in low-wage jobs, with no discernible impact on employment. In his 2013 State of the Union address, President Obama called on Congress to raise the Federal minimum wage, which has remained at $7.25 an hour since 2009. Even as Congress has failed to act, 18 States and the District of Columbia—along with dozens of local government jurisdictions—have answered the President’s call to action and have raised their minimum wages. (In addition to the States that have already raised their minimum wages, voters in four States approved measures to raise the minimum wage in November.) To assess the impact of minimum wage increases implemented by States in recent years, CEA analyzed data from the payroll survey for workers in the leisure and hospitality industry—a group who tend to earn lower wages than those in other major industry groups and thus are most likely to be affected by changes in the minimum wage. As the chart below shows, hourly earnings grew substantially faster for leisure and hospitality workers in States that raised their minimum wages than in States that did not. By comparing trends in wage growth for the two groups, CEA estimates that increases in the minimum wage led to an increase of roughly 6.6 percent in average wages for these workers. At the same time—consistent with a large body of economic research that has tended to find little or no impact of past minimum wage increases on employment—leisure and hospitality employment followed virtually identical trends in States that did and did not raise their minimum wage since 2013. (See here for more details on CEA’s analysis.)
3. The strengthening labor market is drawing individuals into the labor force, offsetting downward pressure on employment growth from the aging of the population. Employment growth depends on three factors: population growth, the rate at which the population participates in the labor force, and the share of the labor force that is employed. The chart below decomposes employment growth (from the household survey) into contributions from each of these factors for each year of the current recovery. It further decomposes labor force participation into shifts attributable to demographics (such as the aging of the U.S. population) and shifts attributable to other factors (such as the business cycle). Throughout the recovery, demographic changes in labor force participation—primarily driven by a large increase in retirement by baby boomers that began in 2008—have consistently weighed on employment growth. In recent years, however, non-demographic changes in labor force participation have supported employment growth, as the strengthening of the labor market and increasing real wages have drawn more individuals into the labor force. The entry (or reentry) of workers into the labor force has helped employment growth maintain its recent solid pace even as the unemployment rate has fallen more slowly. These two shifts in labor force participation—demographic and non-demographic—have largely offset one another in recent months, and as a result the overall labor force participation rate has remained broadly stable since the end of 2013.
4. The number of unemployed workers per job opening, an indicator of labor market slack, is near its lowest level prior to the recession. Using data from the household survey and the Job Openings and Labor Turnover Survey, the chart below plots the ratio of unemployed workers to total job openings. In the recession, unemployment rose rapidly while job openings plummeted, sending the ratio of unemployed workers to job openings to a record peak of 6.6 in July 2009. As the unemployment rate has decreased over the course of the recovery, and as job openings have climbed to record highs this year, the ratio of unemployed workers to openings has fallen steeply, standing at 1.4 as of September (the most recent data available for openings). This is close to the ratio’s lowest level in the 2000s expansion, another indicator—in addition to recent increases in real wages—of a strengthening labor market.
5. The distribution of job growth across industries in November diverged from the pattern over the past year. Above-average gains relative to the past year were seen in professional and business services (+49,000, excluding temporary help services), while mining and logging (which includes oil extraction) posted a gain (+2,000) for the second time in recent months amid moderation in oil prices. On the other hand, retail trade (-8,000), information services (-10,000), and financial activities (+6,000) all saw weaker-than-average growth. Slow global growth has continued to weigh on the manufacturing sector, which is more export-oriented than other industries and which posted a loss of 4,000 jobs in November. Across the 17 industries shown below, the correlation between the most recent one-month percent change and the average percent change over the last twelve months was -0.06, the lowest level since September 2012.
As the Administration stresses every month, the monthly employment and unemployment figures can be volatile, and payroll employment estimates can be subject to substantial revision. Therefore, it is important not to read too much into any one monthly report, and it is informative to consider each report in the context of other data as they become available.
Unfortunately for Donald Trump, whose candidacy depends upon economic suffering, the US economy continues to grow, in fact, Real GDP grew 2.9% in the third quarter, and exports grew at 10%, the fastest quarterly pace since 2013, while consumer spending continued to grow at a solid pace.
But with the disinformation campaign intact, which the Trump campaign sees as the only way to an increasingly elusive victory, Dan Kowalski, Trump’s Deputy Policy Director, stated, “America can do better than the modest growth of 2.9 percent recorded for the 3rd quarter and the dismal growth of 1.5 percent for the past year. Growth hasn’t risen above 3 percent for a full year in any year of the Obama presidency. Decades of strong economic growth and global leadership have been replaced with low-paying jobs, global chaos and a national debt that has doubled under Obama-Clinton.
“The single most important issue facing the American people is an economy that has failed to deliver jobs, incomes, and opportunity. The Trump economic plan creates at least 25 million jobs and 4 percent growth through tax, trade, energy and regulatory reforms.”
In contrast, Hillary for America Senior Policy Advisor Jacob Leibenluft stated: “Today’s GDP release shows economic growth at its fastest pace in two years. With more than 15 million jobs created since early 2010 and real median incomes growing more than 5 percent last year, it’s clear we’ve made real progress coming back from the crisis. But Hillary Clinton believes there is still more we need to do to build an economy that works for everyone, not just those at the top. Independent experts agree her plan would create good-paying jobs through investments in infrastructure, innovation and education. Donald Trump, on the other hand, would take us backwards, with experts across the political spectrum warning his plans would risk another recession and cost jobs.”
Jason Furman, Chairman of the Council of Economic Advisers, issued the following statement today on the advance estimate of GDP for the third quarter of 2016. You can view the statement HERE.
Summary: Real GDP grew 2.9 percent at an annual rate in the third quarter, with strong export growth and continued strength in consumer spending.
The economy grew 2.9 percent at an annual rate in the third quarter of 2016, a noticeably faster pace than in the first half of the year. Exports, which have faced significant headwinds in recent years from slow growth abroad, grew at an annual rate of 10.0 percent in the third quarter, their fastest quarterly pace since 2013. Consumer spending continued to grow at a solid pace in the third quarter, while inventory investment (one of the most volatile components of GDP) boosted GDP growth after subtracting from it in the prior five quarters. In contrast to the pattern of recent quarters, business fixed investment also contributed positively to GDP growth, though it continues to be restrained by slower global growth. But more work remains to strengthen economic growth and ensure that it is broadly shared, and the President will continue to take steps to promote greater competition across the economy, including in the labor market; support innovation; and call on Congress to increase investments in infrastructure and to pass the high-standards Trans-Pacific Partnership.
FIVE KEY POINTS IN TODAY’S REPORT FROM THE BUREAU OF ECONOMIC ANALYSIS (BEA)
Real Gross Domestic Product (GDP) increased 2.9 percent at an annual rate in the third quarter of 2016, according to BEA’s advance estimate. Consumer spending grew 2.1 percent in the third quarter following its strong second-quarter growth of 4.3 percent, with continued solid growth in durable goods spending and a contraction in nondurable goods spending. Inventory investment—one of the most volatile components of GDP—added 0.6 percentage point to GDP growth in the third quarter after subtracting 1.2 percentage point in the second quarter. Nonresidential fixed investment contributed positively to GDP growth for the second quarter in a row, due in large part to a pickup in structures investment growth (see point 4 below). Residential investment declined for the second quarter in a row, albeit at a slower pace in the third quarter than in the second quarter. Notably, exports grew 10.0 percent at an annual rate in the third quarter, its fastest quarterly growth since late 2013, despite continued headwinds from slow growth abroad (see point 3 below).
The pace of third-quarter real GDP growth was noticeably faster than its pace in the first half of 2016. Real GDP growth averaged 1.1 percent at an annual rate in the first half of 2016. The pickup in growth in the third quarter can be attributed largely to two components of GDP: inventory investment and exports. In the first half of the year, these components contributed -0.8 percentage point and 0.1 percentage point, respectively, to overall real GDP growth. Both components saw substantial pickups in growth in the third quarter relative to the first half of the year: inventory investment contributed 0.6 percentage point to GDP growth, while exports contributed 1.2 percentage point, their second-largest quarterly contribution to growth since 2010. Other components of GDP, including both structures and equipment investment and government purchases, also saw faster growth or smaller contractions in the third quarter. These were partly offset by smaller positive contributions from consumer spending and intellectual property products investment and a larger negative contribution from residential investment.
Real exports grew 10.0 percent in the third quarter, their fastest quarterly growth since 2013. In recent years, slowing global demand has been a key headwind to U.S. growth, as the volume of U.S. exports to foreign countries is sensitive to GDP growth abroad. In its October World Economic Outlook, the International Monetary Fund (IMF) revised down its forecast of global growth for the four quarters of 2016, removing an expected pickup in growth from 2015 to 2016. The IMF currently forecasts global growth to pick up in 2017, suggesting less downward pressure on export growth going forward. Nevertheless, real export growth in the third quarter was substantially faster than in recent quarters, due in part to a large increase in agricultural exports. (As shown in the chart below, real export growth had slowed even faster in recent quarters than the slowdown in world growth would have implied, potentially explaining some of the bounce-back in the third quarter.) The sensitivity of U.S. exports to foreign demand and the large contribution of exports to overall growth in the third quarter underscore both the importance of opening foreign markets to U.S. exports by passing the high-standards Trans-Pacific Partnership and the agreement’s potential to strengthen the U.S. economy as a whole.
As oil prices have risen slightly in recent months, contractions in oil-related investment have weighed somewhat less on overall growth. The price of Brent crude oil was $31 per barrel in January 2016, nearly three-quarters lower than its recent peak in June 2014. While the decline in oil prices has benefitted consumers and the economy overall, it has weighed heavily on both mining and logging employment and on investment in mining exploration, shafts, and wells—which includes petroleum drilling structures—which declined by nearly two-thirds from the fourth quarter of 2014 through the second quarter of 2016. Partly as a result, overall structures investment subtracted an average of 0.2 percentage point from quarterly real GDP growth over this period. From its trough in January, however, the monthly price of Brent crude oil increased to $47 per barrel as of September, and the number of oil and natural gas rigs in operation (which reflects the rate of drilling for new oil and natural gas) has risen for five consecutive months. Consistent with the increase in oil prices, investment in mining exploration, shafts, and wells contracted more slowly in the third quarter of 2016 than in earlier quarters, and overall structures investment added 0.1 percentage point to GDP growth. Since both oil-related investment and employment tend to lag prices by several months, the recent moderation in oil prices may translate into a slowdown in the pace of employment losses and further slowing in the rate of contraction in mining exploration, shafts, and wells investment in future quarters.
Real private domestic final purchases (PDFP)—the sum of consumption and fixed investment—rose 1.6 percent at an annual rate in the third quarter, a somewhat slower pace than in recent quarters. PDFP—which excludes more volatile components of GDP like net exports and inventory investment, as well as government spending—is generally a more reliable indicator of next-quarter GDP growth than current GDP. In the third quarter, the divergence between overall real GDP growth and the relatively weaker contribution of PDFP to growth was largely accounted for by the large positive contributions of inventory investment and exports to real GDP growth. Overall, PDFP rose 1.9 percent over the past four quarters, above the pace of GDP growth over the same period.
As the Administration stresses every quarter, GDP figures can be volatile and are subject to substantial revision. Therefore, it is important not to read too much into any single report, and it is informative to consider each report in the context of other data as they become available.
The White House issued this Fact Sheet about the third revision in second quarter economic growth estimates:
WASHINGTON, DC – Jason Furman, Chairman of the Council of Economic Advisers, issued the following statement today on the third estimate of GDP for the second quarter of 2016. You can view the statement HERE.
Summary: Real GDP growth in the second quarter was revised up to 1.4 percent at an annual rate according to BEA’s third estimate.
Second-quarter economic growth was revised to 1.4 percent at an annual rate in the third estimate, up 0.3 percentage point from the second estimate. Consumer spending grew strongly at 4.3 percent in the second quarter—its second-fastest quarterly growth since 2006—and, in contrast to recent quarters, net exports and business fixed investment also added to GDP growth. Some of this growth was offset by a large decline in inventory investment (one of the most volatile components of GDP), along with declines in residential investment and government spending. Overall, growth in the most stable and persistent components of output—consumption and fixed investment—was revised up to 3.2 percent. Today’s report underscores that there is more work to do, and the President will continue to take steps to strengthen economic growth and boost living standards by promoting greater competition across the economy; supporting innovation; and calling on Congress to increase investments in infrastructure and to pass the high-standards Trans-Pacific Partnership.
FIVE KEY POINTS IN TODAY’S REPORT FROM THE BUREAU OF ECONOMIC ANALYSIS (BEA)
Real Gross Domestic Product (GDP) increased 1.4 percent at an annual rate in the second quarter of 2016, according to BEA’s third estimate. Consumer spending grew 4.3 percent, well above its pace over the prior four quarters, with faster growth in both durable and nondurable goods spending. In addition, export growth was positive in the second quarter, and net exports contributed positively to GDP growth. Nonresidential fixed investment increased modestly in the second quarter, with strong growth in intellectual property products investment (see point 4 below) offset by continued weakness in both structures and equipment investment. Inventory investment—one of the most volatile components of GDP—subtracted 1.2 percentage points from GDP growth. Residential investment contracted following eight straight quarters of increases.
Real Gross Domestic Income (GDI)—an alternative measure of output—decreased 0.2 percent at an annual rate in the second quarter. (In theory, GDP and GDI should be equal, but in practice they usually differ because they use different data sources and methods.) The average of real GDP and real GDI, which CEA refers to as real Gross Domestic Output (GDO), increased 0.6 percent at an annual rate in the second quarter. CEA research suggests that GDO is a better measure of economic activity than GDP (though not typically stronger or weaker).
Second-quarter real GDP growth was revised up 0.3 percentage point, though the overall pattern of growth remained largely unchanged following revisions. Revisions in the third estimate included an upward revision to nonresidential fixed investment (which now is estimated to have made a positive contribution to GDP growth), reflecting a smaller contraction in structures investment than originally estimated. Smaller upward revisions to exports and inventory investment were partly offset by a small downward revision to the services component of consumer spending.
In today’s release, BEA revised down its estimate of real GDI growth in the second quarter from an increase of 0.2 percent to a decrease of 0.2 percent due to a downward revision to State-level data on indirect business taxes.
Real personal consumption expenditures, which account for over two-thirds of GDP, grew 4.3 percent at an annual rate in the second quarter, supported by rising real incomes. The second quarter of 2016 ranked as the second-strongest quarter for consumer spending growth since 2006. Consumer spending contributed 2.9 percentage points to GDP growth in the second quarter, reflecting improved economic conditions for many households. This month, the Census Bureau reported that real median household income increased 5.2 percent from 2014 to 2015, the fastest annual growth on record. Data from 2016—including a continued solid pace of job growth and a noticeable pickup in real hourly earnings—point to further strong gains in household incomes. The chart below shows four-quarter percent changes in real consumer spending and in aggregate real wages and salaries paid by domestic employers. The two series tend to move closely together, though the correlation between the two fell during the 2000s business cycle, as growth in consumer spending far outpaced growth in real aggregate wages and salaries. This was likely due to the rapid accumulation of household debt during this period, which sustained the faster growth in consumption. Deleveraging by households over the recession and the recovery has sharply increased the correlation of growth in wages and consumer spending in the current business cycle, such that recent gains in real incomes are likely to support continued strength in consumer spending growth in future quarters.
Real private investment in research and development (R&D) made a larger contribution to GDP growth in the second quarter than in any previous quarter on record. Private R&D investment contributed 0.28 percentage point to overall GDP growth, accounting for most of the 9.0-percent growth in intellectual property products (IPP) investment and offsetting weakness in other components of business fixed investment. Private R&D investment grew at a 17.0-percent annual rate in the second quarter, the second-fastest quarterly growth since 1960. Private R&D investment has reached an all-time high as a share of overall output. Although this share (1.8 percent) is still relatively small, increased investment in R&D can help boost productivity growth in the future, which will be needed to help reverse the slowdown across advanced economies in the last decade.
Real private domestic final purchases (PDFP)—the sum of consumption and fixed investment—rose 3.2 percent at an annual rate in the second quarter, noticeably faster than overall GDP growth. PDFP—which excludes more volatile components of GDP like net exports and inventory investment, as well as government spending—is generally a more reliable indicator of next-quarter GDP growth than current GDP. In the second quarter, the divergence between the strong contribution of PDFP to growth and the relatively slower growth of overall real GDP was largely accounted for by the large negative contribution of inventory investment. Overall, PDFP rose 2.3 percent over the past four quarters, above the pace of GDP growth over the same period.
As the Administration stresses every quarter, GDP figures can be volatile and are subject to substantial revision. Therefore, it is important not to read too much into any single report, and it is informative to consider each report in the context of other data as they become available.
WASHINGTON, DC – Jason Furman, Chairman of the Council of Economic Advisers; Sandra Black, Member of the Council of Economic Advisers; and Matt Fielder, Chief Economist of the Council of Economic Advisers; issued the following statement today on the Census Income, Poverty, and Health Insurance Data. You can view the statement HERE.
Summary: In 2015, household income grew at the fastest rate on record, the poverty rate fell faster than at any point since 1968, and the uninsured rate continued to fall.
Today’s report from the Census Bureau shows the remarkable progress that American families have made as the recovery continues to strengthen. Real median household income grew 5.2 percent from 2014 to 2015, the fastest annual growth on record. Income grew for households across the income distribution, with the fastest growth among lower- and middle-income households. The number of people in poverty fell by 3.5 million, leading the poverty rate to fall from 14.8 percent to 13.5 percent, the largest one-year drop since 1968, with even larger improvements for African Americans, Hispanic Americans, and children. Meanwhile, the ratio of earnings for women working full-time, full-year to earnings for men working full-time, full-year increased to 80 percent in 2015, the highest on record. Every State has seen declines in its uninsured rate since 2013 as the major coverage provisions of the Affordable Care Act have taken effect. Solid employment growth and robust real wage growth so far this year suggest that incomes are continuing to rise in 2016, and, building on the progress shown in today’s Census report, the President will continue to call on Congress to take steps to invest in job creation, wage growth, and equal pay for equal work.
SIX KEY POINTS IN TODAY’S REPORT FROM THE CENSUS BUREAU
1. Real median household income rose by 5.2 percent in 2015, the fastest growth on record. Median household income grew $2,798 to $56,516 in 2015, the first time that annual real income growth exceeded 5 percent since the Census Bureau began reporting data on household income in 1967. Data from 2016 so far point to further strong gains in real household incomes, which depend on employment, nominal wages, and inflation. As of August, total nonfarm job growth has averaged a solid 182,000 jobs a month so far in 2016, and hourly earnings for private-sector workers have increased at an annual rate of 2.8 percent, much faster than the pace of inflation (1.3 percent as of July, the latest data available).
2. The total number of Americans below the poverty line fell by 3.5 million from 2014 to 2015, and the official poverty rate fell to 13.5 percent due to the largest one-year drop since 1968. The poverty rate for children under age 18 fell by 1.4 percentage point (p.p.) from 2014 to 2015, equivalent to more than 1 million children lifted out of poverty. Meanwhile, the poverty rate for those ages 18 to 64 saw its largest one-year decline on record (-1.1 p.p.), and poverty fell 1.1 p.p. for those ages 65 and older. As noted below (see point 5), the official poverty rate does not reflect the full effect of antipoverty policies because it includes only pre-tax income and excludes the direct effect of key policies like the Supplemental Nutrition Assistance Program (SNAP) and the Earned Income Tax Credit (EITC). The Supplemental Poverty Measure, which is designed to include the effects of these programs but also takes into the cost of basic needs when setting the poverty threshold, decreased 1.0 percentage point in 2015, from 15.3 percent to 14.3 percent.
3. Households at all income percentiles reported by the Census Bureau saw gains in income, with the largest gains among households at the bottom of the income distribution. While real median household income increased 5.2 percent, gains were even larger in the lower half of the income distribution, ranging from an increase of 5.5 percent for households at the 40th percentile to an increase of nearly 8 percent for households at the 10th percentile. While households at the top half of the income distribution also saw increases, their gains were smaller, with an increase of 2.9 percent in the 90th percentile of household income. 2015 marked the first time real household income grew at all percentiles reported by the Census Bureau since 2006, and real income growth in 2015 was the fastest since 1969 for the 10th, 20th, 40th, 50th, and 60thpercentiles. Although the level of income inequality remains high, multiple measures of inequality—including the Gini coefficient, the ratio of the 90th percentile of income to the 10th percentile, and the share of income going to households at the top of the income distribution—fell modestly in 2015 as a result of this pattern of income growth.
4. All racial and ethnic groups saw increases in household incomes and decreases in poverty in 2015. As shown in the chart below, all racial and ethnic groups saw gains in real median household income and reductions in their respective poverty rates. Hispanic Americans saw both the largest gains in median income (6.1 percent), while Black Americans and Hispanic Americans saw the largest reductions in poverty (-2.1 p.p. and -2.2 p.p., respectively). The Supplemental Poverty Measure (SPM), which includes the effects of a number of important antipoverty programs (see point 5 below), shows a similar pattern, with all racial and ethnic groups seeing reductions in poverty.
5. In 2015, refundable tax credits like the Earned Income Tax Credit (EITC) and the Child Tax Credit (CTC) lifted 4.8 million children out of poverty. The Supplemental Poverty Measure (SPM), which includes the effects of a large number of antipoverty programs, is widely acknowledged to measure poverty more accurately than the official measure. Unlike the official poverty measure, the SPM measures post-tax and post-transfer resources, combining earnings with assistance from government programs—including in-kind transfers like food assistance—minus net tax liabilities and necessary expenditures on work, child care, and health care. The measure also bases the poverty line on the cost of meeting basic expenses. Together, in 2015, 9.2 million Americans, including 4.8 million children, were lifted above the poverty line by refundable tax credits, including the EITC and the CTC, illustrating their critical importance to the social safety net. Additionally, research has shown that helping low-income working families through the EITC and CTC not only reduces poverty, but also has positive longer-term effects on children, including improved health, educational outcomes, and labor force participation and earnings in adulthood. Expansions to the EITC and CTC signed into law by President Obama as part of the American Recovery and Reinvestment Act of 2009 lifted 1.0 million children out of poverty in 2013 according to the Center on Budget and Policy Priorities; these provisions were made permanent under the bipartisan agreement at the end of 2015. The President’s Fiscal Year 2017 Budget includes a number of provisions to further strengthen tax credits for working families, including an expansion of the EITC to workers without qualifying children. (Note that some of these estimates rely on survey data, which research has shown tend to underreport household use of certain programs like the Supplemental Nutrition Assistance Program, leading to underestimates of the poverty-reducing effects of these programs.)
6. In 2015, the share of people without health insurance declined in almost every State, and all States have seen gains since 2013, reflecting continued progress under the Affordable Care Act (ACA). Today’s new data from the American Community Survey (ACS) show that 49 States and the District of Columbia saw their uninsured rates decline in 2015. The uninsured rate has fallen in every State (as well as in the District of Columbia) since 2013. While the ACS is not the firstsurvey to report estimates of State-level insurance coverage in 2015, the survey’s extremely large sample size allows it to provide particularly reliable estimates.
While all States have seen increases in insurance coverage since the ACA’s major coverage provisions took effect in the beginning of 2014, the extent of those gains have varied widely by State. Notably, States that have expanded Medicaid under the ACA have seen larger coverage gains on average, particularly if they started with a larger uninsured population. If Medicaid non-expansion States had seen coverage gains comparable to those seen by Medicaid expansion states with similar uninsured rates, the uninsured rate in these states would have been nearly 3 percentage points lower in 2015, increasing the magnitude of these states’ coverage gains since 2013 by almost two-thirds.
Today’s Census release also included an estimate of the national change in the uninsured rate based on the Current Population Survey (CPS). According to the CPS, the national uninsured rate dropped by 1.3 percentage points from 10.4 percent in 2014 to 9.1 percent in 2015, bringing the cumulative gain since 2013 to 4.3 percentage points. The new data from the CPS are broadly consistent with evidence from other Federal and private surveys showing that coverage gains continued during 2015; those surveys show that gains have continued into early2016. The cumulative coverage gains since 2013 have put the uninsured rate at its lowest level ever.
Jason Furman is Chairman of the Council of Economic Advisers. Sandra Black is a Member of the Council of Economic Advisers. Matt Fiedler is Chief Economist of the Council of Economic Advisers.